[fusion_builder_container hundred_percent=”no” hundred_percent_height=”no” hundred_percent_height_scroll=”no” hundred_percent_height_center_content=”yes” equal_height_columns=”no” menu_anchor=”” hide_on_mobile=”small-visibility,medium-visibility,large-visibility” class=”post-link-tag ” id=”” background_color=”” background_image=”” background_position=”center center” background_repeat=”no-repeat” fade=”no” background_parallax=”none” enable_mobile=”no” parallax_speed=”0.3″ video_mp4=”” video_webm=”” video_ogv=”” video_url=”” video_aspect_ratio=”16:9″ video_loop=”yes” video_mute=”yes” video_preview_image=”” border_size=”” border_color=”” border_style=”solid” margin_top=”” margin_bottom=”” padding_top=”” padding_right=”” padding_bottom=”” padding_left=””][fusion_builder_row][fusion_builder_column type=”1_1″ layout=”1_1″ spacing=”yes” center_content=”no” link=”” target=”_self” min_height=”” hide_on_mobile=”small-visibility,medium-visibility,large-visibility” class=”” id=”” background_color=”” background_image=”” background_position=”left top” undefined=”” background_repeat=”no-repeat” hover_type=”none” border_size=”0″ border_color=”” border_style=”solid” border_position=”all” padding_top=”” padding_right=”” padding_bottom=”” padding_left=”” margin_top=”” margin_bottom=”” animation_type=”” animation_direction=”left” animation_speed=”0.3″ animation_offset=”” last=”no”][fusion_text columns=”” column_min_width=”” column_spacing=”” rule_style=”default” rule_size=”” rule_color=”” class=”” id=””]Ever since they were announced, Google’s Core Web Vitals caused a lot of commotion in the SEO and web development world.
Since they’re introduced as an official ranking factor they’ll have the power to make or break your SEO (and business).
The purpose of this update is to ensure website provide the best possible user experience.
So, to improve your website UX and continue ranking high in Google search, you must optimize and improve your Core Web Vital scores.
In this article, we’ll go in-depth about this update, each Core Web Vital metric, see how it can impact your business, and learn how to optimize them.
Table of Contents
What are Core Web Vitals
Core Web Vitals are a set of metrics intended to measure how users experience the speed, responsiveness, and visual stability of a page. Essentially, they represent a way for Google to quantify and gauge user experience of a web page and help determine its rankings.
Google uses a designated group of metrics known as Page Experience Signals to assess the user experience of a website which are used to determine rankings (among other factors). Core Web Vitals will fall under this category once it officially launches in May 2021.
While you will be able to view these elements in Google Search Console prior to the launch date, Core Web Vitals will start impacting your ranking only after the fact.
Original Page Experience factors include:
- Mobile-friendliness
- Safe browsing
- HTTPS
- No intrusive interstitials
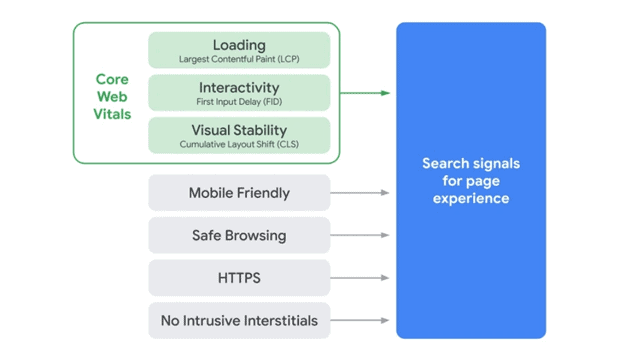
Core Web Vitals are a set of newly-introduced ranking factors that Google takes into consideration when calculating the user experience score on your website. It consists of three main user-centred measurements:
- Cumulative Layout Shift (CLS) – measures visual stability during page loading
- Largest Contentful Paint (LCP) – measures the loading time from clicking the link to seeing all the content on a page
- First Input Delay (FID) – measures website interactivity
Now that’s a mouthful. But it’s not as complicated as it sounds.
In the simplest of terms, Core Web Vitals measure different layers of web usability, such as interactivity, store loading time, and how stable the content is while it’s loading.
Here’s a more detailed breakdown of each metric.
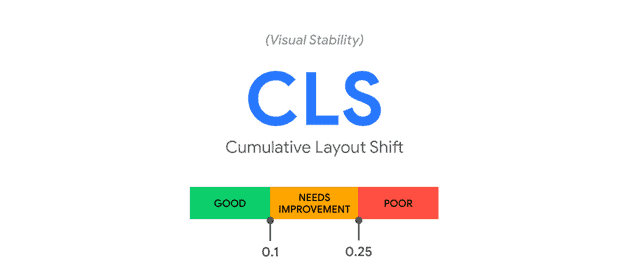
Cumulative Layout Shift (CLS)
CLS measures content stability, or the lack thereof. This metric analyzes whether your page elements move around the page as it’s being loaded.
Here’s a visual representation of a website, in this case, TechCrunch, where elements aren’t stable while loading.

As you can see in the GIF above, the way elements are arranged when you enter the website differs from the end result once the page is fully loaded.
This is bad for your UX score because visitors can click on wrong buttons or links by accident, which will make them roll their eyes and think that you’re not investing a lot of effort into providing your visitors with an optimal experience.
These visual element fluctuations usually occur because other elements were later added or resized on that same page. CLS measures the stability levels by summing scores of layout shifts that don’t happen within 500ms of user input. It does so by comparing the frames and calculating how severe these shifts are.
It is important to note that Google only counts unexpected shifts.
If you have drop-down menus on your website or any other elements that are intended to move when you place a curser on top, those won’t be counted as layout shifts.
In terms of scoring, a higher CLS number indicates poor content stability, while lower numbers mean that your content is following Google’s best practices.
Ideally, your pages shouldn’t have a CLS score beyond 0.1.
CLS is closely connected to the Largest Contentful Paint (LCP) metric because the faster the page fully loads, the less time it will have to mess up the elements and content stability on your website.
And that brings us to the next important Core Web Vitals metric.
Largest Contentful Paint (LCP)
Largest Contentful Paint measures how fast the largest content elements load once the user opens the respective link. For example, if you have a rather simple landing page with a large video, that video would be considered the LCP.
It follows the logic that the biggest elements on the page are usually the most impressionable. So, if the most prominent webpage element loads rapidly, it will seem as though your website is very fast.
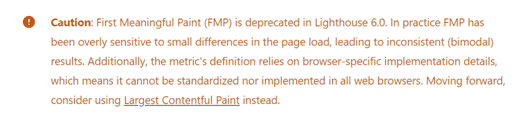
IMPORTANT: This is not to be confused with total page speed loading time or other metrics such as First Meaningful Paint (FMP). FMP measures how long it takes for the first piece of content to load on a page. However, it was later disregarded as faulty because it couldn’t figure out the most meaningful piece of content on a page, and it produced inconsistent results. That’s why Google recommends replacing it with LCP.
One important thing to know about LCPs is that they’re dynamic, meaning that the first element to load isn’t necessarily the main LCP on that page.
Here’s a visual representation by Google of how LCPs look and interact with the page.
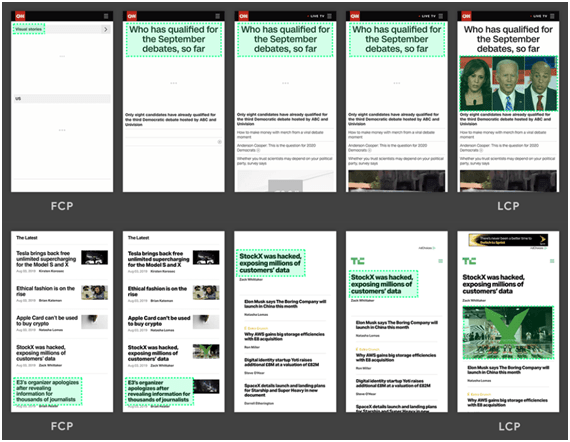
As you can see in the image above, the largest page element changes as the page is being loaded.
First, we have the ‘’Visual Stories’’ section, which is the main candidate for LCP. Soon after, the title pops up as the next largest element on the page. In the last screenshot, though, an image pops up as the main LCP candidate.
When you dissect the loading process this way, you see how LCP is actually a very useful metric from the UX point of view. You can use the score as an indicator of when to work on improving your website load time.
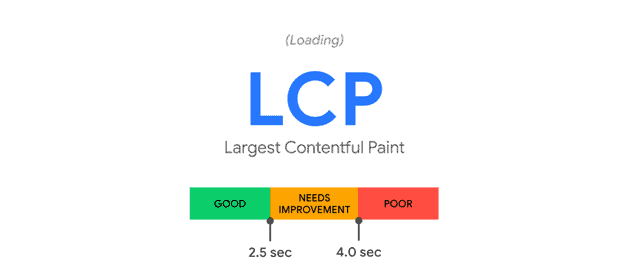
Ideally, your pages should load before the 2.5-second mark. Anything between 2.5 and 4 seconds will require some improvement, while scores above 4 seconds mean that you should consider redesigning your website or landing pages.
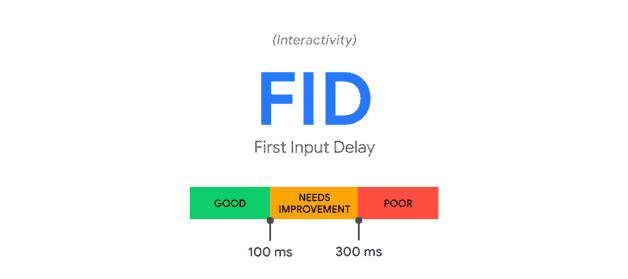
First Input Delay (FID)
The final Core Web Vitals metric is First Input Delay (FID), which measures how your website interacts with users. The way the website interacts with the user is measured by calculating how long it takes for the desired action to occur once the user initiates it.
Now, you may be thinking – how can a website interact with a user? SEOs and website optimizers are used to measuring how the user interacts with content – clicks, forwards, opens, conversions, etc.
But FID interactive metric is something completely different yet quite similar.
For example, if a user clicks on a button, the FID metric would measure how long it took the website to complete that action, aka take them to the next page. Some other interactions include:
- Clicking on different menu options
- Submitting forms
- Entering your email
- Clicking buttons
This metric isn’t as important for content-based websites such as blogs or news because these websites usually entail only simple interactions – scrolling or zooming in the text.
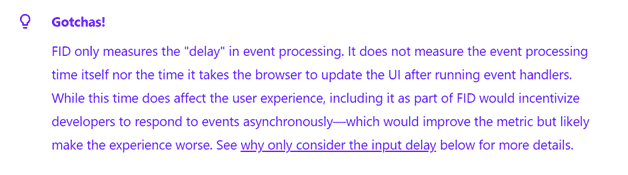
Another thing to note is that FID doesn’t only measure the speed of the first interaction but also how long it actually takes the user to perform a certain action on your website. In short, it only measures the delay during processing.
Usually, input delays occur when the browser’s main thread is occupied doing something else; hence it cannot process the request instantly.
Let’s look at a typical web page loading process. Below, you’ll see an example of a page that is making resource network requests. Once they’re downloaded, they’re then processed on the main thread.
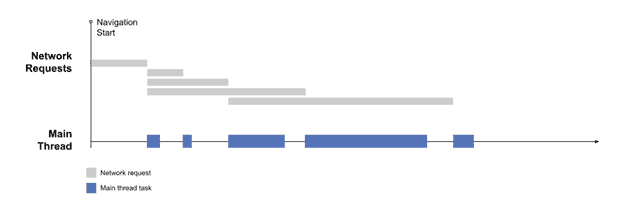
Expectedly, due to these requests, the main threat is occupied with work, which is visually represented with blue blocks.
The said delays usually happen between First Contentful Paint (FCP) and Time to Interactive (TTI) because some content has been rendered, but the rest isn’t fully loaded yet. Here’s another visual representation:
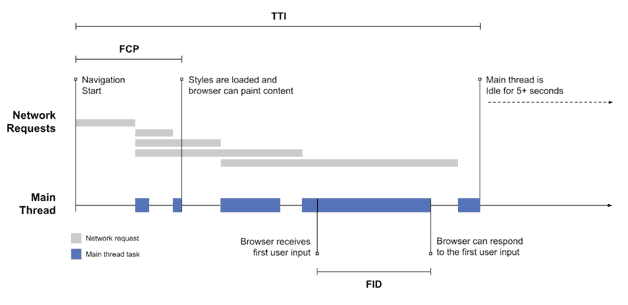
As you can see, there are three long tasks to be complete between FCP and TTI. If the user tried to click on a button during these processes, they would notice a delay between the moment they click the button and the moment the next page loads.
Because the user’s action happened while the main thread was running a certain task, it had to wait until the task was finalized before being able to respond to the user’s input. Well, the said wait time is going to be the FID value for that particular user on your website.
Ideally, your website’s FID should be below 100 milliseconds. Scores between 100 and 300 milliseconds are acceptable, though some improvement is recommended. Anything above 300 milliseconds is considered to be poor, meaning that it’s the right time to optimize your pages.
Why Core Web Vitals matter for your business
Core Web Vitals are important for your business because they impact all search results directly, both mobile and desktop. However, what you might not have known is that Core Web Vitals also influence whether your website will appear in Google Top Stories (content that is visible at the top of search results).
Until now, Accelerated Mobile Pages (AMP) was the main requirement for appearing in top stories. Well, AMP is going away as a requirement for top stories, and Core Web Vitals will be the next important criteria to meet.
Besides appearing in Google Top Stories, Core Web Vitals are important for a plethora of other reasons, namely:
- SEO and ranking benefits
- User experience quality
- Return on investment
Core Web Vitals impact your SEO rankings
Core Web Vitals, in unison with other Page Experience elements, are an important aspect of how well your website will rank on Google. Google believes that user experience is an important factor for business success, which is why it’s been shifting the ranking metrics towards these factors.
Search engines want to engage users by promoting content and websites that are well-rounded, informative and offer a stellar user experience. Expectedly, these websites will rank better than others.
On the other hand, websites with poor Core Web Vitals scores will likely plummet in rankings.
While Page Experience won’t take up the full 100% of your SEO score, they will definitely play an important role, so make sure to improve your website before it officially launches.
Google has published a ton of quality resources to ensure that webmasters, business, and SEO experts have more than enough time to optimize their websites before the update is fully implemented.
Stay tuned for pro tips and tricks on how to optimize and improve each Core Web Vital metric, and soar to the top of Google search results.
Core Web Vitals measure your website’s user experience
As we have stated multiple times throughout this article, the whole point of introducing Core Web Vitals is to measure the quality of user experience.
Put yourself in users’ shoes for a moment. Who likes broken pages, unstable elements, and slow loading time? I know I don’t.
Users want a smooth and quick experience – enter the website, browse, perform the desired action, and leave with a smile on their face.
If they come across an unhealthy website not-optimized for Core Web Vitals, they’ll likely just click away and look elsewhere.
Chasing buttons and links on a page while they move around is time-consuming, tiresome, and frustrating. And it’s just a bad look for your company – it seems as though you’re not investing any effort into ensuring that your customers can interact with your website without difficulties.
Core Web Vitals are there to quantify this experience and give actionable data which you can use to improve your website and overall user experience.
Core Web Vitals can impact your business’ bottom line
When we combine the two reasons mentioned above, we come to the conclusion that Core Web Vitals have the power to affect your bottom line. Regardless of whether you’re looking to improve your WooCommerce store, your SaaS business, or any other type of online operations, you know well that Google can make or break your earnings.
If your website disappears from the top search results, it will be harder and more expensive to drive new website visitors.
Obviously, fewer visitors and customers lead to fewer sales, which ultimately destroys your bottom line.
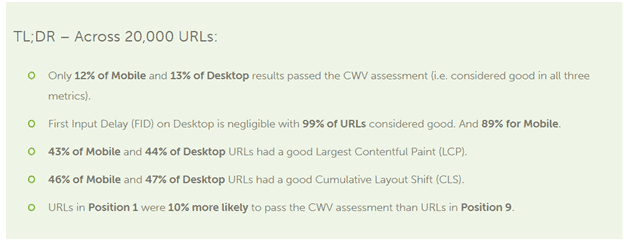
Research showed that only 12% of URLs had a good score on mobile devices, while only 13% has done the same on desktop devices. Moreover, the URLs with high scores had ranked better compared to websites with lower scores.
How to check Core Web Vitals score
To improve your Core Web Vitals score, first, you have to analyze your website and see which areas require improvement. Tracking these metrics is rather simple and can be done through a couple of different platforms.
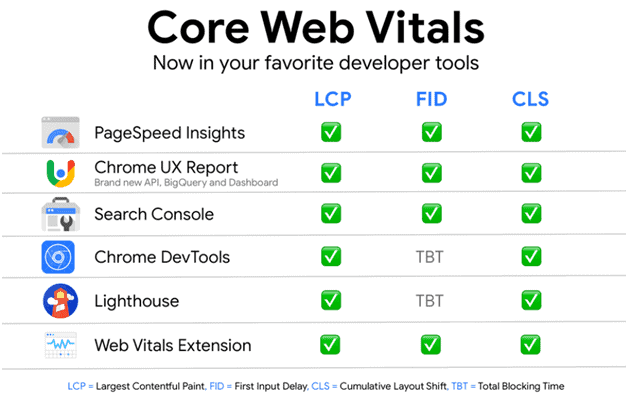
While using third-party services to analyze these factors is acceptable, we recommend using Google’s official tools because they’re the most comprehensive and accurate.
Below, we’ll explain how to use Google Page Speed Insights and Google Search Console to analyze your Core Web Vitals and improve your SEO efforts.
Monitor your Core Web Vitals score in Google Search Console
Google Search Console is the easiest and most accurate way to check your Core Web Vitals score. Here’s how to access the report:
- Head over to your Google Search Console page
- Choose Core Web Vitals from the left-side menu
- Go through each score and figure out the best way to optimize it (or read our Core Web Vitals optimization guide below)
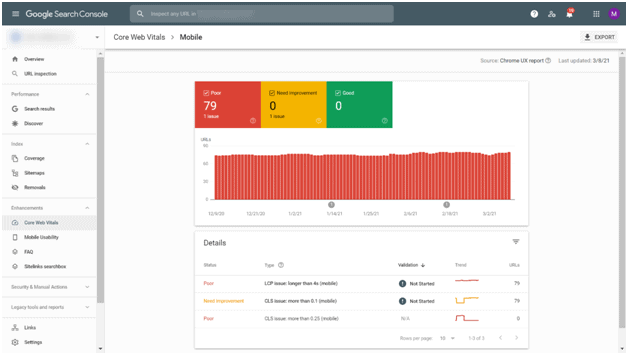
The Core Web Vitals panel has replaced the former Speed Report on the menu.
You can choose to check both desktop and mobile results.
Google Search Console groups Core Web Vital metrics by status, metric type, and URL group.
Remember that GSC only includes indexed pages. If you can’t find a certain page within the report, it’ either because it hasn’t been indexed yet, or the URL hasn’t gathered the minimum amount of reporting data in the CrUX report.
Here’s how to navigate the report:
- Toggle the coloured tabs from the overview page (Poor, Needs Improvement, Good)
- Click the Open Report option to check the summary pages for both desktop and mobile
- To see which URL groups are affected by specific results, just click on that row in the table, and results will be displayed
- Open the Examples tab and select a specific URL to see more information about potential issues.
Use Google PageSpeed Insights to check your Core Web Vitals
The second-best way to view and analyze your Core Web Vitals score is via Google PageSpeed Insights. This tool is already partially implemented in the Google Search Console tool, but you can use it to break down your Core Web Vital results even further.
Both tools measure the same factors, but PageSpeed allows you to check URLs separately.
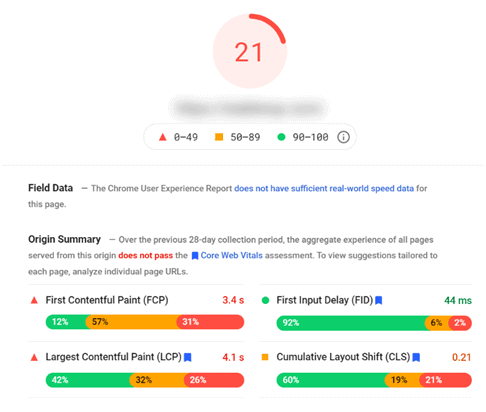
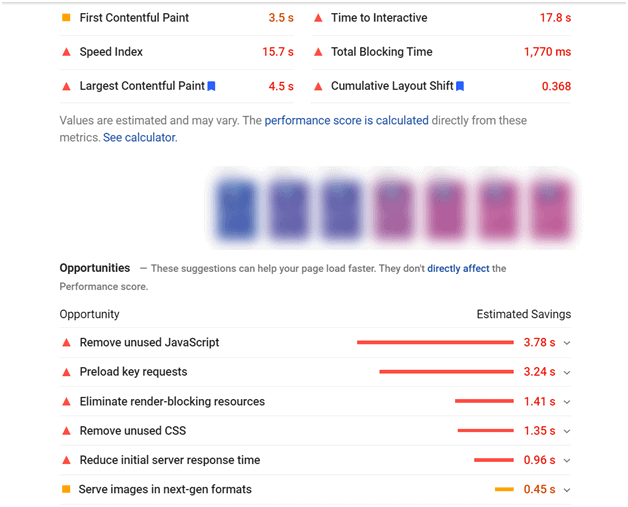
PageSpeed Insights also provides you with actionable recommendations for improving your website’s user experience. You will see different values, as well as opportunities, such as:
- Remove unused scripts
- Reduce initial server response time
- Preload key requests
- Eliminate render-blocking resources
You can also use PageSpeed API to check Core Web Vitals. Here’s how:
- Open your command line
- Run the following command:
curl -o response.txt
“https://www.googleapis.com/pagespeedonline/v5/runPagespeed?url=https://developers.google.com” - You will receive a response.txt file that sums up the performance data. To check a different webpage, just replace the URL query.
- Open the response file and find the loading experience line. You will see the following information:
- Percentile – ninetieth percentile observation for each metric
- Distributions – the percentage of affected users for each speed metric (slow, average, fast)
- Category – shows the performance of each of the metrics
- Locate the originLoadingExperience property to view the aggregated Core Web Vitals report for the entire origin instead of a single URL.
NOTE: If you want to see Core Web Vitals results for the mobile version, just include the strategy=mobile query parameter to the API string.
How to improve Core Web Vitals score
This Core Web Vitals update has scared many business owners – we don’t blame you. We’ve already seen how certain website issues can hurt your earnings. We don’t want that to happen, do we?
Luckily, Google has taken this into consideration, which is why they announced the release a whole year before the official launch date.
That gives you more than enough time to analyze your website thoroughly, think of fixes and ways to improve it and implement these changes before the update rolls out.
Below, we’ll discuss what causes issues with each Core Web Vitals metric and share actionable tips and steps on how to improve it.
How to optimize Largest Contentful Paint (LCP)
An important factor that determines the quality of user experience is how fast the elements on your webpage load. There are different types of webpage loading time metrics, one of which is LCP.
LCP measures how long it takes for the largest element to fully load on your page. If you’re wondering why your website has a poor LCP score, here are some potential reasons:
- Slow and lazy server response times
- Your resources are loading slowly
- Content render is blocking CSS and JavaScript
- Client-side rendering
First, consider improving how and where your server handles the website content. You measure the server response time using Time to First Byte (TTFB).
Once you receive the result, you can improve it by optimizing your server and caching assets.
If your server is taking too long to complete certain queries, you should consider displaying a static page on a browser request, meaning that the webpage should be created dynamically.
If you want your HTML to remain static, though, then caching assets might help with speeding up the loading time. Here’s how you can do that:
- Set up reverse proxies to act as a cache server
- Tweak your cloud service provider’s cache behaviour
- Store your cache closer to users by using a CDN
Some other quick and easy fixes include:
- Removing unused and unnecessary third-party scripts
- Upgrade your hosting plan or service
- Remove large and bulky page elements
- Minify your code
- Serve HTML pages cache-first
- Employ lazy loading
- Postpone non-critical and unused CSS on your website
- Inline important CSS
- Compress images and text files
How to optimize First Input Delay (FID)
FID measures how long your website takes to respond to the first user-based interaction. This metric can’t be simulated in a lab environment because it requires actual user interaction to be measured. The most common cause of poor FID scores is heavy JavaScript execution.
This happens because the user’s browser is unable to respond to the main user input before it executed the JavaScript on the main thread (check the illustration in our FID section at the beginning of the article).
One way to reduce the JavaScript execution time is to limit the amount of JavaScript on your website. To do so, consider:
- Minimizing any unused polyfills
- Remove unused JavaScript
JavaScript is render-blocking because it can’t run a lot of complex tasks simultaneously. Instead, it has to prioritize activities, which causes poor FID scores.
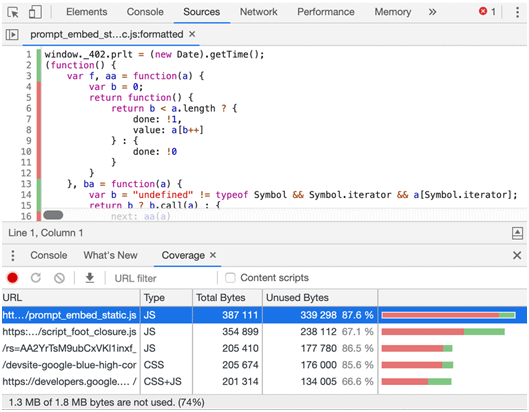
You can use Chrome DevTools to check which parts of JavaScript and CSS are unnecessary:
- Enable the Coverage feature by navigating to the Command Menu and choosing Show Coverage.
- Open the Coverage tab in Chrome DevTools.
- Click the record or refresh button to start capturing unused code
Once you locate and extract the unused code, here’s how you can reduce it:
- Split the bundle code into multiple portions
- Use async and defer commands to defer third-party scripts and unused JavaScript
Or you can use Web Workers to delegate processes on the main thread. Web Workers will disperse tasks between the main and worker thread, so the main thread can focus on processing user input.
One last FID fix to consider is using browser cache. The cache saves the recurring information from a webpage so that it loads faster once the user opens the webpage for the second time.
Improving your FID score will boost your website’s accessibility and ensure that your customers can navigate your website smoothly, quickly, and efficiently.
How to optimize Cumulative Layout Shift (CLS)
Lastly, we’ll learn how to diagnose and optimize Cumulative Layout Shifts. Even though layout shifts are very common, they are still very annoying and bothersome. These shifts usually happen because certain elements have been added or resized recently. While those two reasons are the most common, other factors that influence your CLS score are:
- Images without set dimensions
- Advertisements without dimensions
- Dynamically injected content
- Web fonts that cause FOIT/FOUT
As a general rule, you should always aim to include size attributes on your media elements. Or, you can use CSS aspect ratio boxes to ensure that the browser allocates enough space to load the image. Here’s how images without specified width and height look:
Modern browsers set the default aspect ratio based on the image’s height and width attributes, so setting them to a certain size will help prevent these layout shifts. If these heights and width attributes are too confusing, you can always use an online calculator to help you out. Another important tip is to add all-new UI elements below the fold.
When it comes to advertisements, they are probably the number one layout shift culprit – there are so many instances where they can cause layout shifts:
- When a site places the ad box in the DOM
- When you resize the ad banner with first-party code
- When the ad tag library loads
You can minimize ad-caused layout shifts by:
- Reserving a static place for the ad
- Style elements before the ad loads
- Don’t collapse the saved space
- Reserve the largest possible size for the ad box
Conclusion
It is safe to say that the release of Core Web Vitals has imposed a lot of stress on business owners, especially because some of the metrics seem too similar to other, already-existing ranking factors.
Unless you’re an experienced developer or technical SEO expert, a lot of recommended fixes might seem extremely difficult or even impossible.
Don’t get discouraged, though – you can always hire professional help to optimize your Core Web Vitals score. Better act fast because the update will roll out in less than two months.
At StableWP, we offer professional web development and SEO services that will help optimize your website and improve Google rankings in no time.
Get in touch to learn how we can help grow your business, outrank competitors, and prepare you for the upcoming Core Web Vitals update.[do_widget id=custom_html-25][/fusion_text][/fusion_builder_column][/fusion_builder_row][/fusion_builder_container]