[fusion_builder_container hundred_percent=”no” hundred_percent_height=”no” hundred_percent_height_scroll=”no” hundred_percent_height_center_content=”yes” equal_height_columns=”no” menu_anchor=”” hide_on_mobile=”small-visibility,medium-visibility,large-visibility” class=”” id=”” background_color=”” background_image=”” background_position=”center center” background_repeat=”no-repeat” fade=”no” background_parallax=”none” enable_mobile=”no” parallax_speed=”0.3″ video_mp4=”” video_webm=”” video_ogv=”” video_url=”” video_aspect_ratio=”16:9″ video_loop=”yes” video_mute=”yes” video_preview_image=”” border_size=”” border_color=”” border_style=”solid” margin_top=”” margin_bottom=”” padding_top=”” padding_right=”” padding_bottom=”” padding_left=”” admin_toggled=”no”][fusion_builder_row][fusion_builder_column type=”1_1″ layout=”1_1″ spacing=”” center_content=”no” link=”” target=”_self” min_height=”” hide_on_mobile=”small-visibility,medium-visibility,large-visibility” class=”” id=”” background_color=”” background_image=”” background_position=”left top” background_repeat=”no-repeat” hover_type=”none” border_size=”0″ border_color=”” border_style=”solid” border_position=”all” padding_top=”” padding_right=”” padding_bottom=”” padding_left=”” dimension_margin=”” animation_type=”” animation_direction=”left” animation_speed=”0.3″ animation_offset=”” last=”no”][fusion_text columns=”” column_min_width=”” column_spacing=”” rule_style=”default” rule_size=”” rule_color=”” class=”” id=””]Ready to take your small business to the next level?!
Using Google Analytics (GA), you can pinpoint exactly what’s working for you, and double-down on that segment. Also discover new, untapped opportunities to target.
Even some of the biggest brands like Uber, Airbnb, and Spotify rely on Google Analytics.
In this article, I am going to show you how to unlock the full potential of Google Analytics, so you can make the right tweaks on your site to increase conversions.
Table of Contents
What is Google Analytics
For those who still don’t know, Google Analytics is a free tool offered by Google that provides a detailed insight into your site’s traffic and performance.
It consists of reports that show you:
- How many people have visited your site
- Who is visiting your site (their location, gender, age)
- Which devices they use to access it
- How people are getting to your site (through Google, Facebook or other social media, directly, etc.)
- What keywords they use to discover you in Google search
- See what visitors are doing once they are on your site
- Which pages and content perform well and which don’t
- Check your site’s loading speed
- Track conversions (how many people have purchased something or signed up for your email list)
- And much, much more…
It’s an incredibly powerful tool that can help you improve your marketing strategy and optimize your site to allow your business to grow and thrive online.
Still not convinced?
Then, check out the top reasons why you need to utilize Google Analytics.
Why you need GA
If you’re still not sure whether you need GA or not, then consider the following 6 reasons why it’s an indispensable tool for you!
- It’s free – Although Google provides Analytics as a freemium tool, all the features that your small business needs are unlocked from the start. You don’t need to worry about paying for anything unless you’re a marketing company operating at an enterprise level.
- You get easy-to-understand reports – Even if you’re not a marketing expert, you can easily understand the data and make informed decisions. Not only will you get stats displayed in numbers, but you’ll also get data visualized with graphs, pie-charts, etc.

And don’t worry, you’ll learn which metrics you need to keep an eye on and how to interpret them in a later section of this article. - It’s comprehensive – No matter what type of business you’re running, or what type of website you have, you can use Google Analytics. It can be used for blogs, big and small business websites, E-commerce stores, WordPress websites, custom coded, and anything in between.
- Know more about your visitors – With GA, you get complete details about your visitors and potential customers, like who they are, where they come from, what they do on your site, devices they’re using, their behavior, etc.
- Measure the performance of your content – You can track and measure how engaging your content is, see which pages visitors spend a lot of time on, which are the most popular blog posts, which content they don’t like, and so much more.
- Identify issues on your site – Find out what parts of your website are not performing well. Track cart abandonments, why your visitors are not going through until the end of the check-out process. Also, which pages cause them to leave your site completely (exit pages).
However, the biggest benefit of Google Analytics doesn’t lie in the data itself, but in what you do with the data.
You need to use GA to make data-driven decisions about your marketing and your business!
When you can understand your visitors, the content they like, and how they discover your website, you can tailor your digital marketing strategy to:
- Grow your traffic
- Keep visitors engaged on your site
- Grow your revenue and business!
Install Google Analytics on your website, leave out the guessing game, and save time and effort on growing your business!
How to set up Google Analytics for your site
Now let me show you how to install GA on your site, properly.
I emphasize “properly,” because many people do have it installed, but not in the correct way. So, their data is skewed and not at all useful for any decision-making.
Follow along with these 3 steps to get GA installed on your site.
Step #1 – Configure your Google Analytics property
Go to the Google Analytics page and sign up for a free account. You can use an existing Google account or create a new one for this purpose.
Then, you’ll be greeted by a screen like this, showing you the three-step setup process of GA.
Next, fill in the information about your account and the website you want to track.
Note that GA refers to your site as your property! So, whenever you see this word “property,” know that it’s something related to your site.
Set your time-zone and check all the boxes below, then click on the “Get Tracking ID” button.
You’ll be taken to this screen containing the tracking code for your site.
Step #2 – Add tracking ID code to your site
There are two ways in which you can do this on your WordPress website:
- Add the tracking ID manually
- Use a WordPress plugin (Monster Insights)
Let me show you the manual method first…
1) Method: Add GA tracking ID manually
Left-click on the box containing the tracking ID (shown in the picture above) to select the entire code and right-click to copy it.
Then go to your WordPress dashboard. To log in, go to your site URL and add “/wp-admin” at the end.
![]()
Navigate to Appearance > Editor.
Now click the header.php file on the right-hand side in the Theme files section.
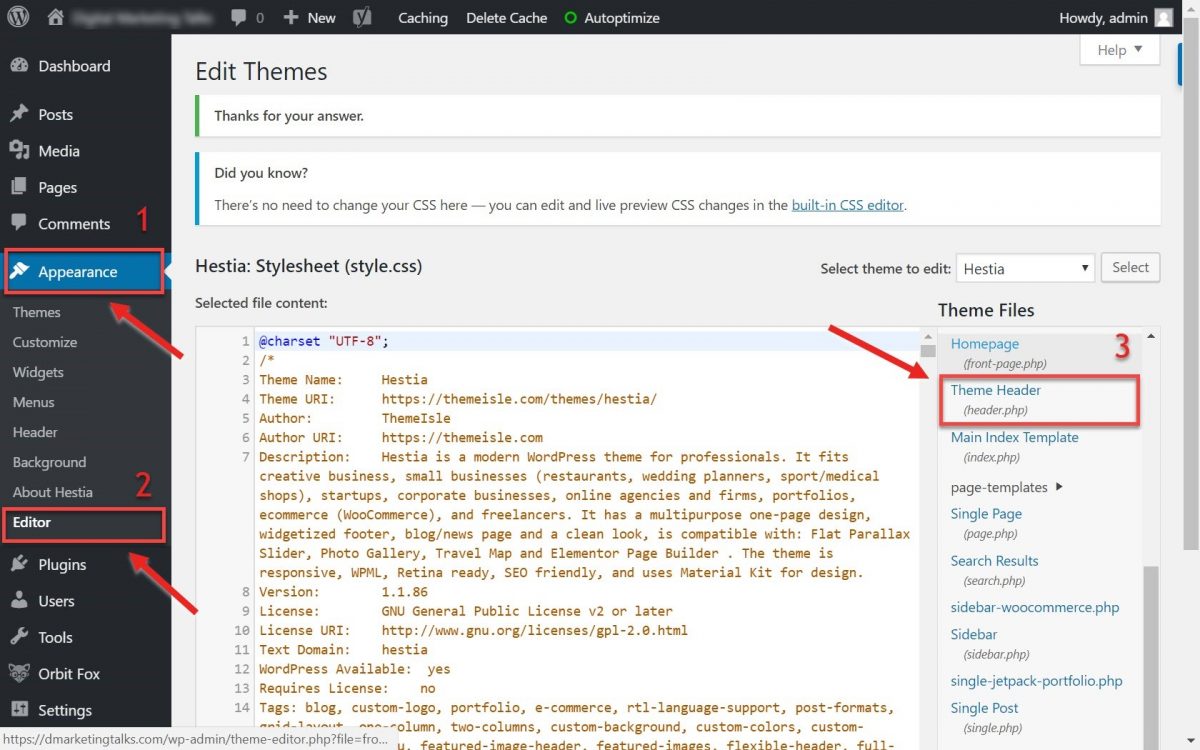
Paste the tracking ID code you just copied from your Analytics account right before the tag.
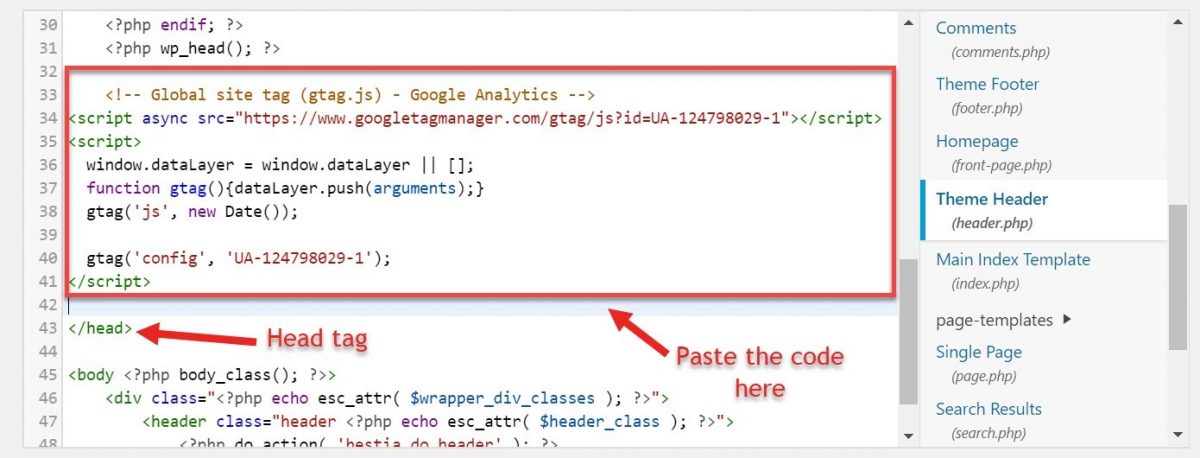
Click on the Update file, and you’re done!
2) Method: Use a WordPress plugin (Monster Insights)
Download and install the Monster Insights plugin.
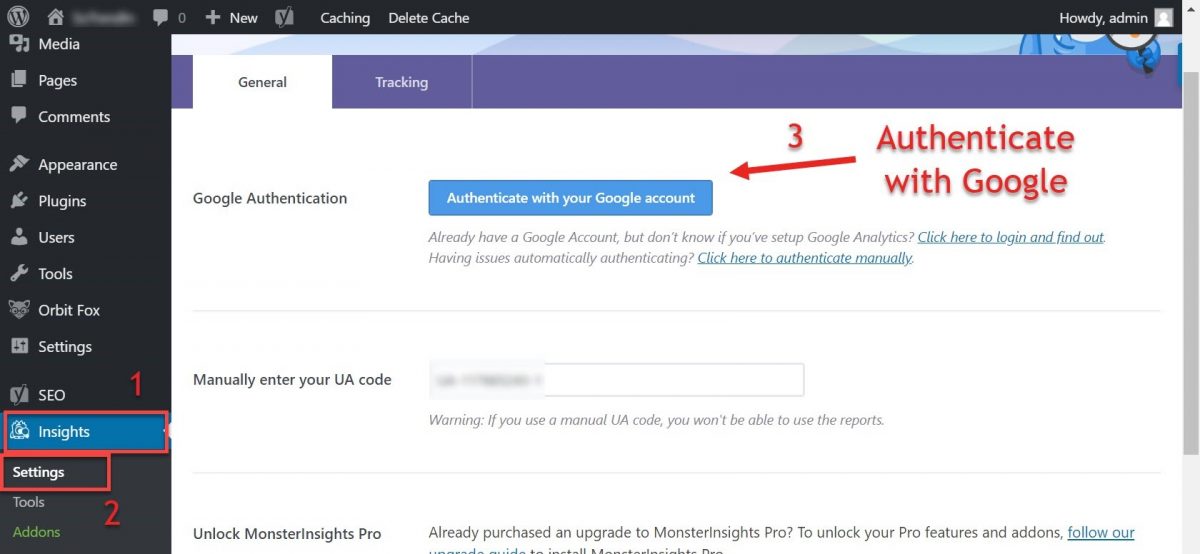
Find Insights > Settings and then click Authenticate with your Google account.
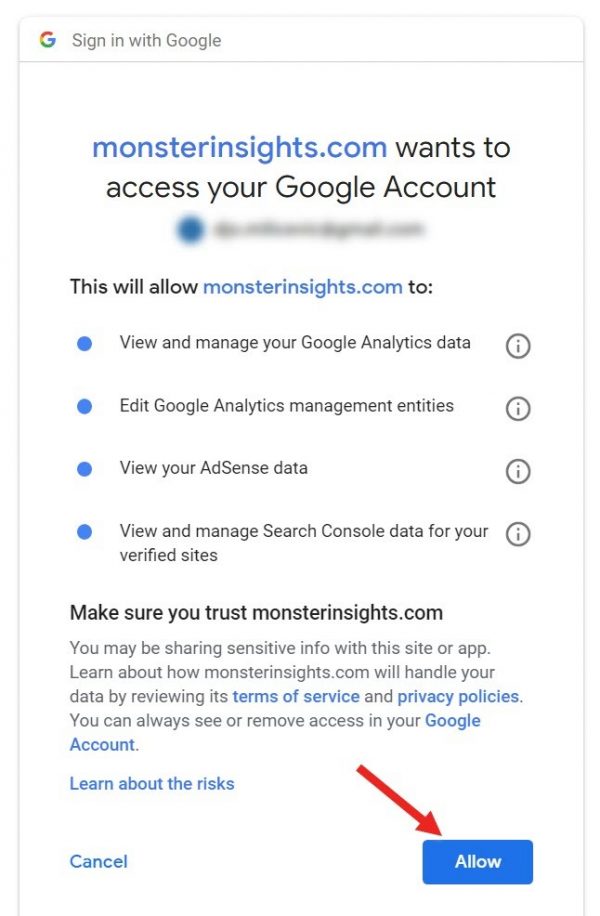
Choose your Google account and then click Allow to allow monsterinsights.com access.
Next, pick the profile that you want to connect to Monster Insights and click Complete Authentication.
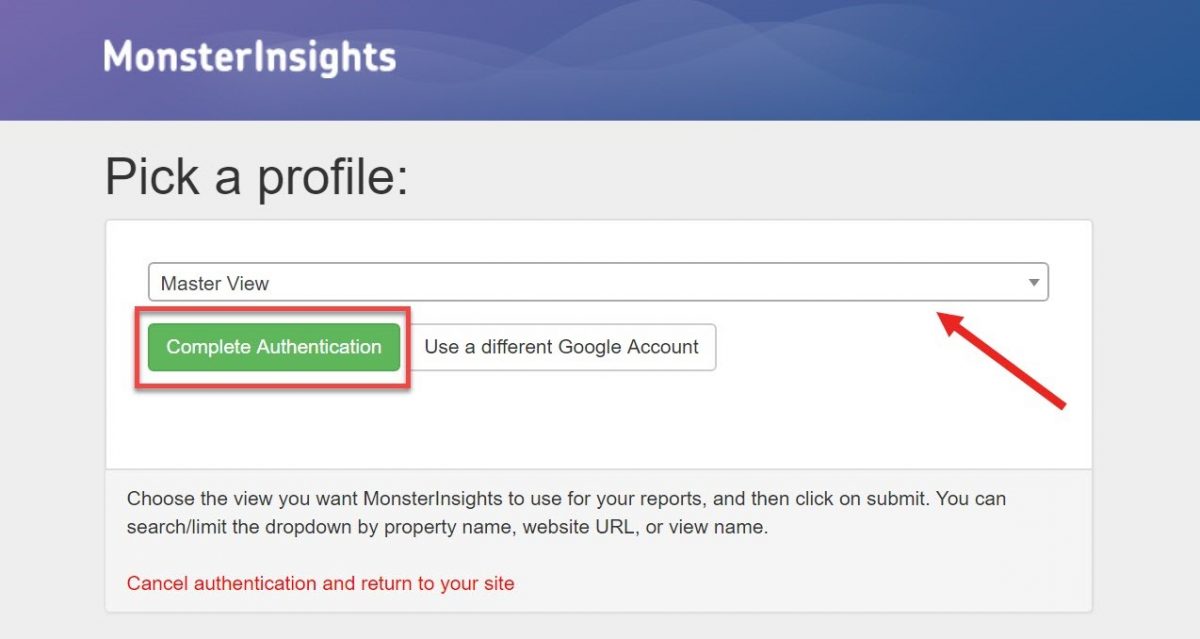
That’s it, you’re good to go!
Take note that Monster Insights also allow you to preview some day-to-day reports about your traffic. If you click on the Insights option in the left-side menu, you’ll see something like this:
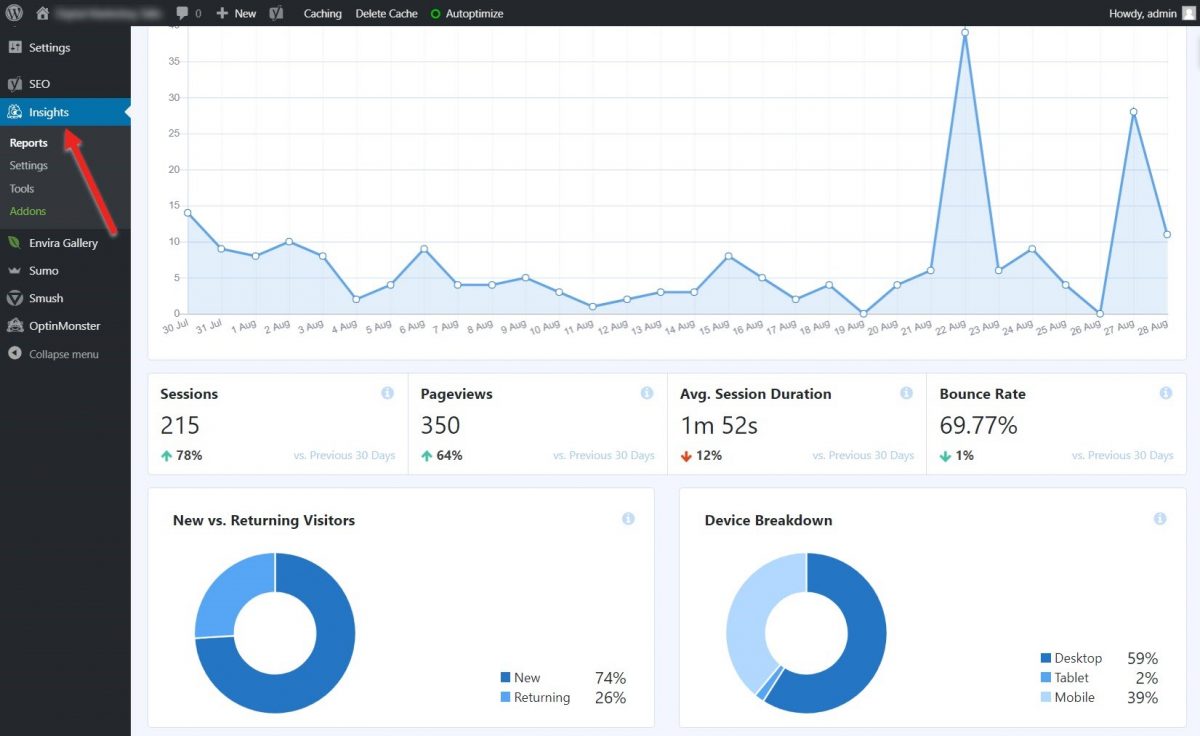
Mind you that, even though this is a cool feature that allows you a quick glance at your traffic stats, it can never replace using the actual Google Analytics tool.
It only shows the data about your traffic, but insights into how people got to your site, what content and pages they visit, goal, conversion, and events tracking, and so much more is only available in your GA account.
Step #3 – Filter-out internal traffic and bots
This is a critical step if you want to set your GA correctly.
The first thing you need to do is filter-out internal traffic, so Google Analytics doesn’t register your own visits as traffic.
To do this, you need to set a common filter that is only going to pick up on external traffic (visits to your site that come from outside sources).
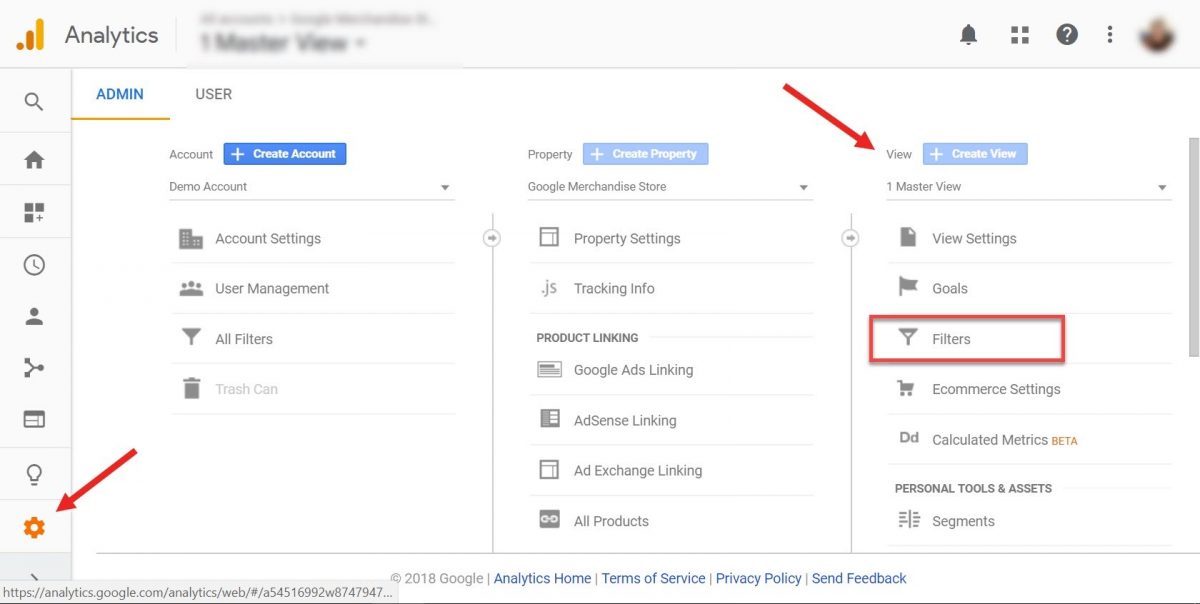
Go to Admin, then navigate to a View column, and select Filters.
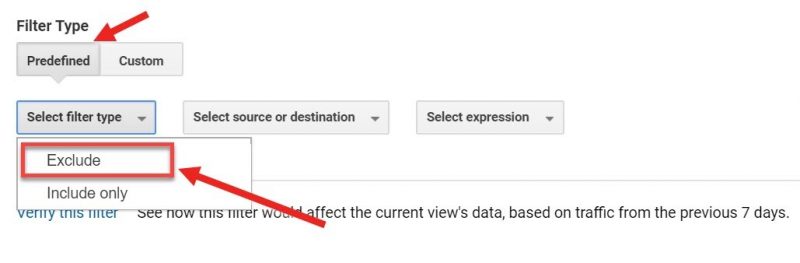
Click on the red button that says Add filter and give it a descriptive name, such as “Exclude internal traffic”.
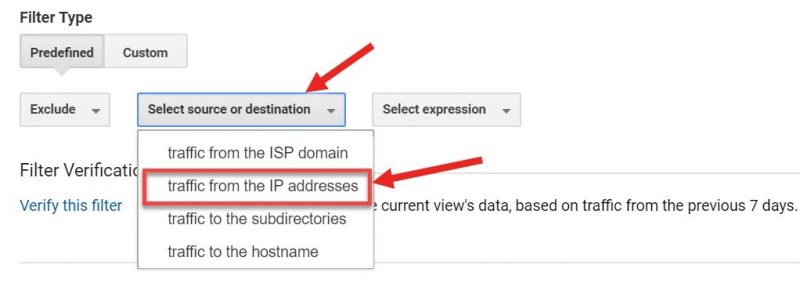
Select Predefined filters and set the filter type as Exclude.
Under “source and destination” select traffic from the IP addresses.
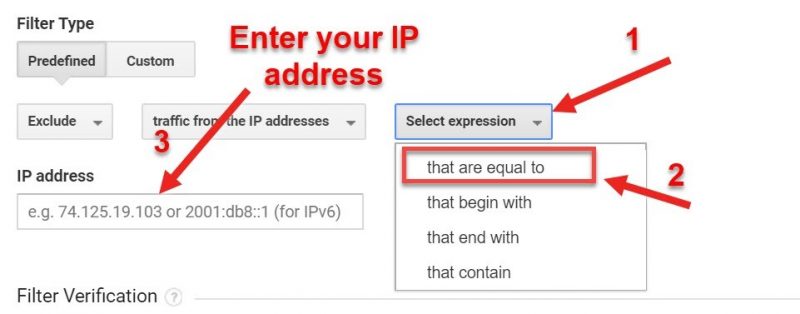
Set expression as “that are equal to” and enter your IP address in the box on the left.
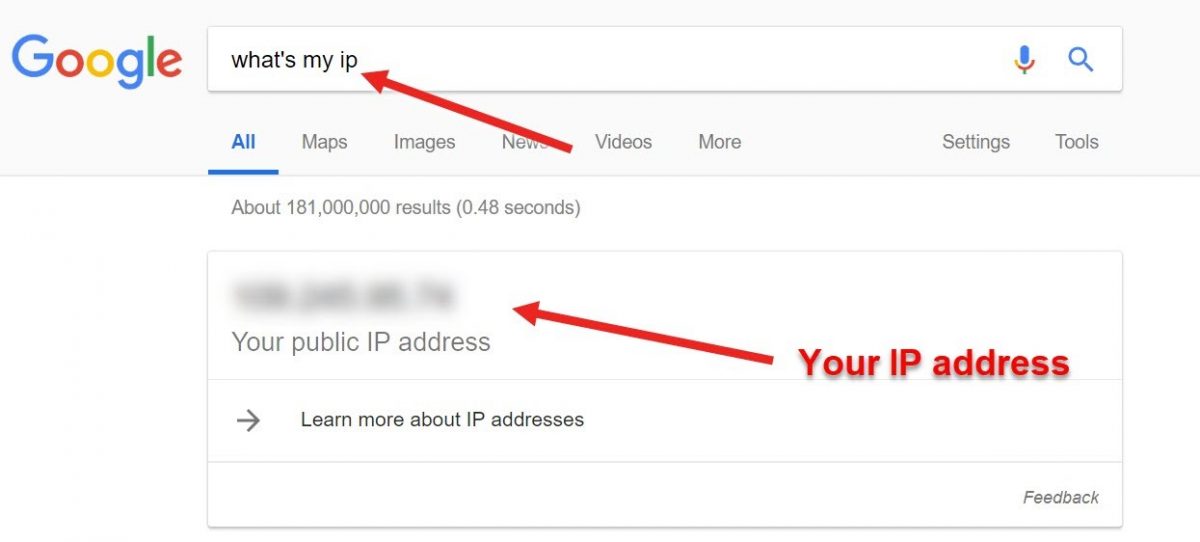
If you’re not sure what your IP address is, you can Google something like, “What’s my IP”.
Once you’re done, click Save, and that’s it.
Note: You can add filters for all IP addresses that you, your employees, or others that maintain your site are using.
Additionally, you can filter out all known bot traffic.
Google, other search engines, and other services may send out bots to visit your site and find out what it’s all about. But that’s another segment of traffic that you don’t want to see in your Analytics reports because it’s not real traffic coming from actual people.
To set this, go to your View column again, select View Settings and then check the box that says Exclude all hits from known bots and spiders.
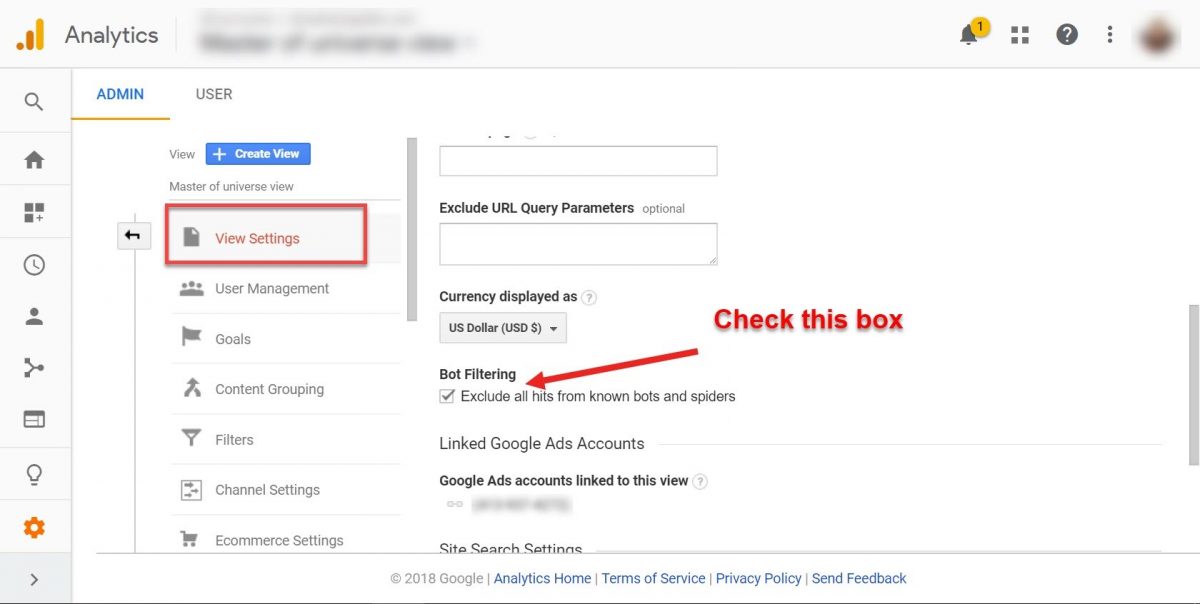
And don’t forget to click Save below!
That’s how you set your Google Analytics account properly, so you only get stats about real traffic that comes to your site.
Overview of Google Analytics standard reports
If you’re a newcomer to Google Analytics, the whole array of available features can be overwhelming. You might not know where to look or where to get started.
What reports are important for your business? What does all of this mean?!
To get your bearings, keep reading and you’ll learn:
- Which standard reports you have available and
- What each of them represents
Your standard reports are listed on the left-side menu of your dashboard, divided into the segments:
- Real-Time
- Audience
- Acquisition
- Behaviour
- Conversions
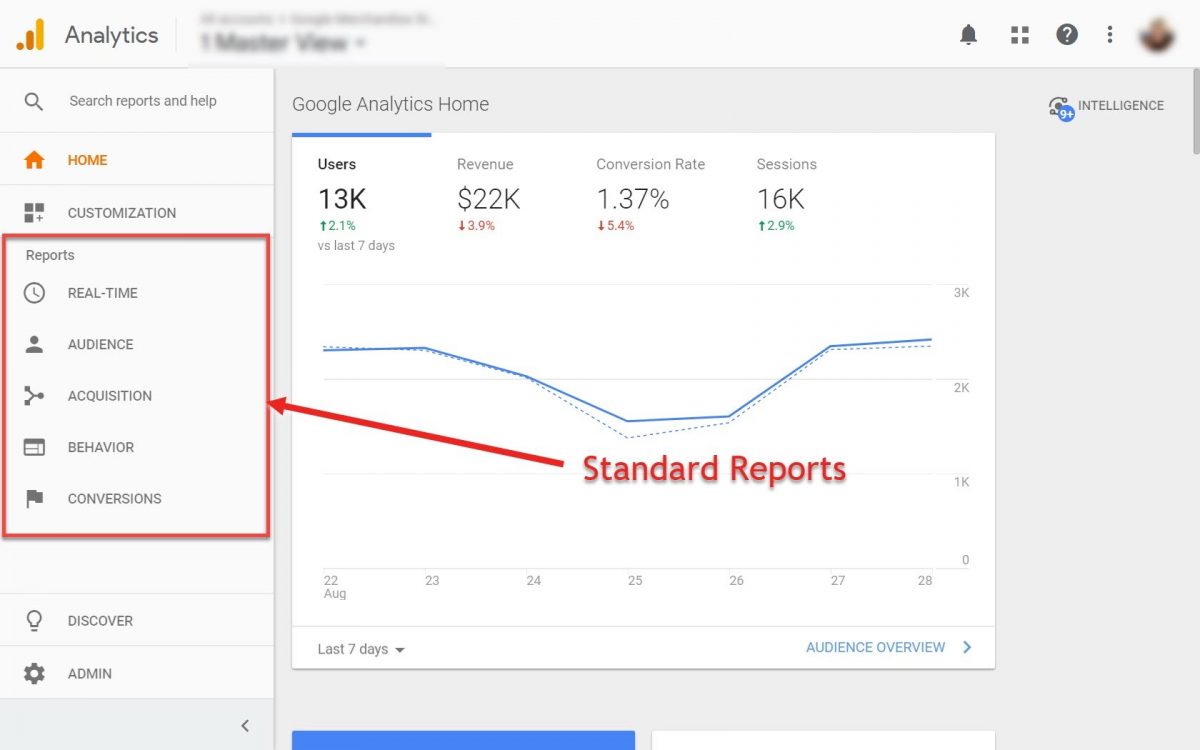
Let’s get into each one of these reports, and I’ll show you what kind of insights you can get from them.
1. Real-Time reports
The Real-Time reports section in GA allows you to monitor activity on your site in real-time, as it happens.
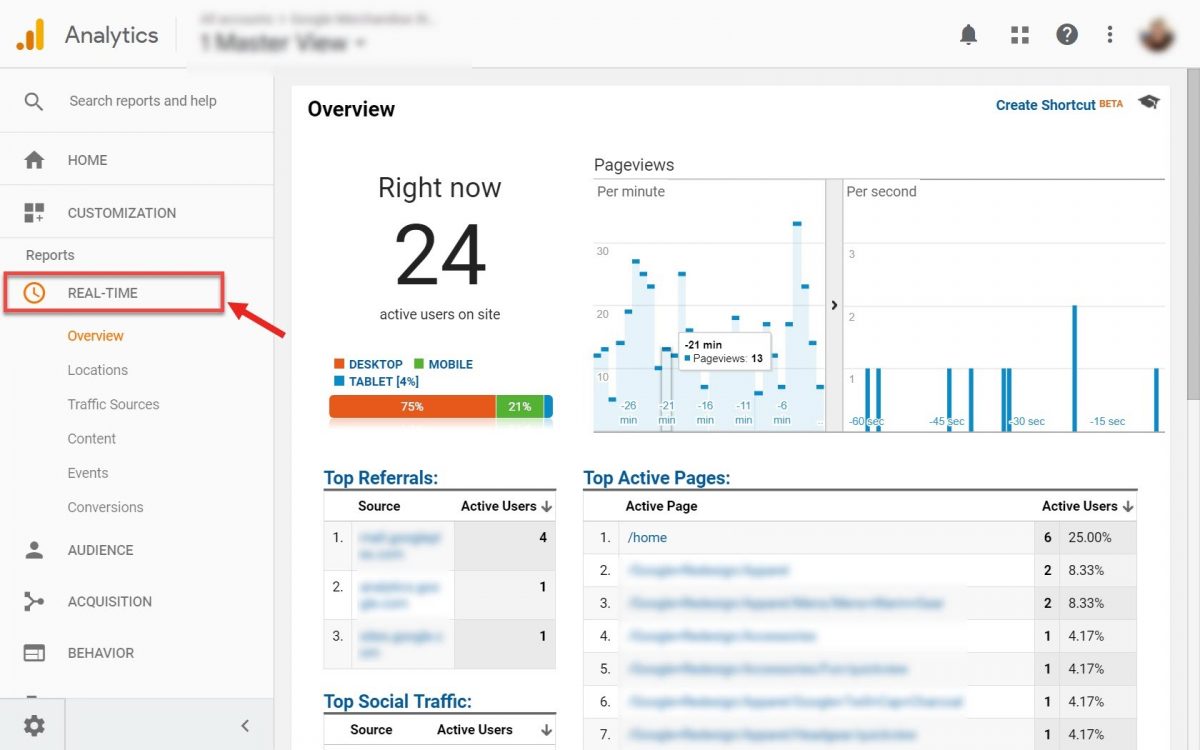
This report is also divided into several sub-reports like:
- Overview – It shows how many users are currently active on your site, a list of the top active pages, top sources of referral traffic, top social traffic sources, the top locations that users are visiting from, and more.
- Locations – Here you can dig deeper and learn where exactly users are accessing your site. You can even click on each country and have a look at the cities where your visitors are coming from.
- Traffic Sources – Indicates where on the web your traffic is coming from. The data is organized by medium (how the visitors are getting to your site – organic search, direct traffic, via email, via social media, and so on), source (the exact website URL, email, etc., that the user is coming from), and the number of active users.

- Content – This report shows which specific pages of your site visitors are currently active on, showing the page URL, the page title, and the number and percentage of active users on that page.
- Events – You can create custom events for interactions on your site – such as button clicks, downloads, video plays, ad clicks, etc., and track their real-time performance with this report.

- Conversions – The Conversions report will track the real-time completion of any Goals you’ve set up in Google Analytics. You will learn more about Goals and Conversions in the next section of this article.

Real-time reports can be useful if you want to take a snapshot of your traffic or track the performance of your campaigns as they unfold.
But the usefulness of these reports is limited.
Keep in mind that most campaigns need some time before they can produce any significant data, so don’t become obsessed with watching these numbers flicker and dance around in front of you.
2. Audience reports
As the name implies, Audience reports tell you more about your site visitors – your audience.
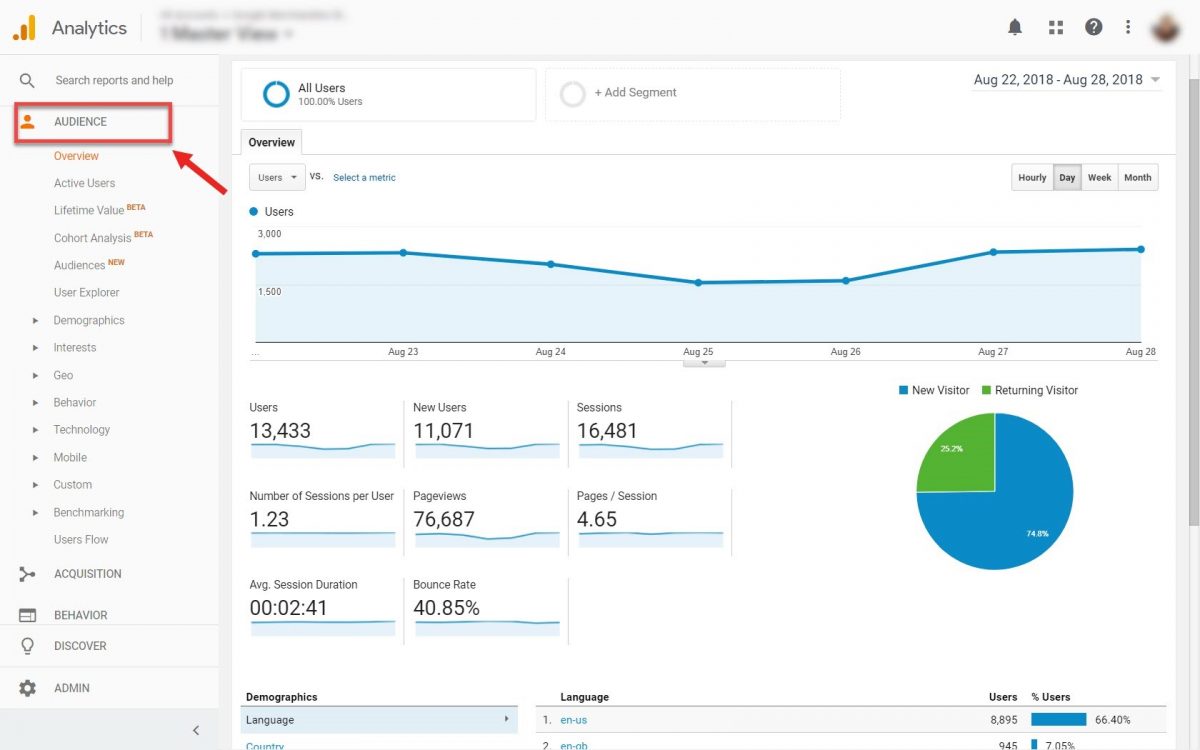
Audience reports drill deep into data about your site’s visitors. That’s why they feature 15 different detailed sub-reports. And many of them have a few of their own sub-sections as well.
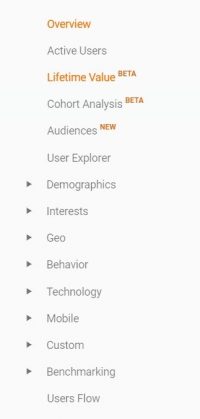
Because it’s such an extensive list of reports, we won’t dive deep into each of them. We’ll only have a quick look at the most important ones for your business.
- Overview – The overview report gives you a compact perspective on your site’s visitors. You can see the number of users, unique users, sessions, page views, bounce rate, and more. Information about language, demographics, devices used, etc., are also available here.

- Active Users – This report gives you stats about the number of unique users who have visited your site over various time periods – 1 day, 7 days, 14 days, and 28 days. It’s mostly used to understand the success of promotional campaigns while they’re running.
- Lifetime Value – This is a feature still in BETA, reserved for e-commerce websites that want to track how much revenue each of their users contributes to. For this to work, you need to enable e-commerce tracking in GA.

- Cohort Analysis – A cohort of users is any group of users that is segmented based on a date. For example, a cohort could be a group of users that visited your site for the first time on the same date or a group of users who completed their first transaction during a specific time period.
- Audiences – You can define your own specific audience that you want to track, like “current shoppers”, “users that view page X”, “users that haven’t purchased in the last month”, etc. To do this, you need to Enable Demographics and Interest Reports and create an audience.

- User Explorer – This report allows you to isolate and examine individual, rather than aggregate, user behaviour. Enable the User-ID feature in your property settings, and you can keep an eye on each individual user (or their unique ID number, to be exact).

- Demographics – As the name implies, this report lets you know about the demographic information of your visitors. You can learn their age and gender to help you tailor content exactly to their needs and preferences. For this, you need to Enable Demographics and Interest Reports mentioned earlier.

- Interests – If you want to know more about the psychographic data of your audience, have a look at these reports. You can learn more about their interests so you can target potential customers better with content and ads that will resonate with them.

- Geo – With Geo reports you can learn more about the language and locations of your visitors. This is especially useful for international brands, but not so much for local businesses.
- Behavior – These behaviour reports break down your audience by how many times they visited your site, how much time they spend on it, and whether or not they are new or returning visitors. This is especially important for content-heavy websites that want to see how engaging their content is, and if the users keep coming back for more.
- Technology – You can find out which operating systems and browsers people use to access your site. You can also see which internet providers bring in the most visitors. All of this is helpful data that you can use to optimize your site’s performance for a specific OS or browser.
- Mobile – If you want to know which devices people use to visit your site, then this is the right report for you. You can see how many of them come from a desktop, mobile, or tablet devices. You can also learn about the exact mobile devices they’re using.

- Custom – In this section, you can create a custom Audience report using your own chosen variables, metrics, and dimensions. You can learn more about it here.
- Benchmarking – Compare your site to others in your industry. For this, you need to enable Benchmarking first.
- Users Flow – You can learn more about the paths your visitors take once they get on your site. Where they are coming from, their traffic sources, which pages they visit, and where they leave your website. This can help you understand their behaviour and identify weak spots on your site. This can be particularly useful for e-commerce sites to understand the path that users typically take to conversion, as well as for bloggers seeking to understand which articles bring the most users to the site, and where users typically navigate after reading them.

3. Acquisition reports
If you want to drive more traffic to your site, then you need to understand how users have reached your website in the past.
The process of getting users to your site is called acquisition, and the section of Google Analytics that shows your stats about this process is named appropriately – Acquisition reports.
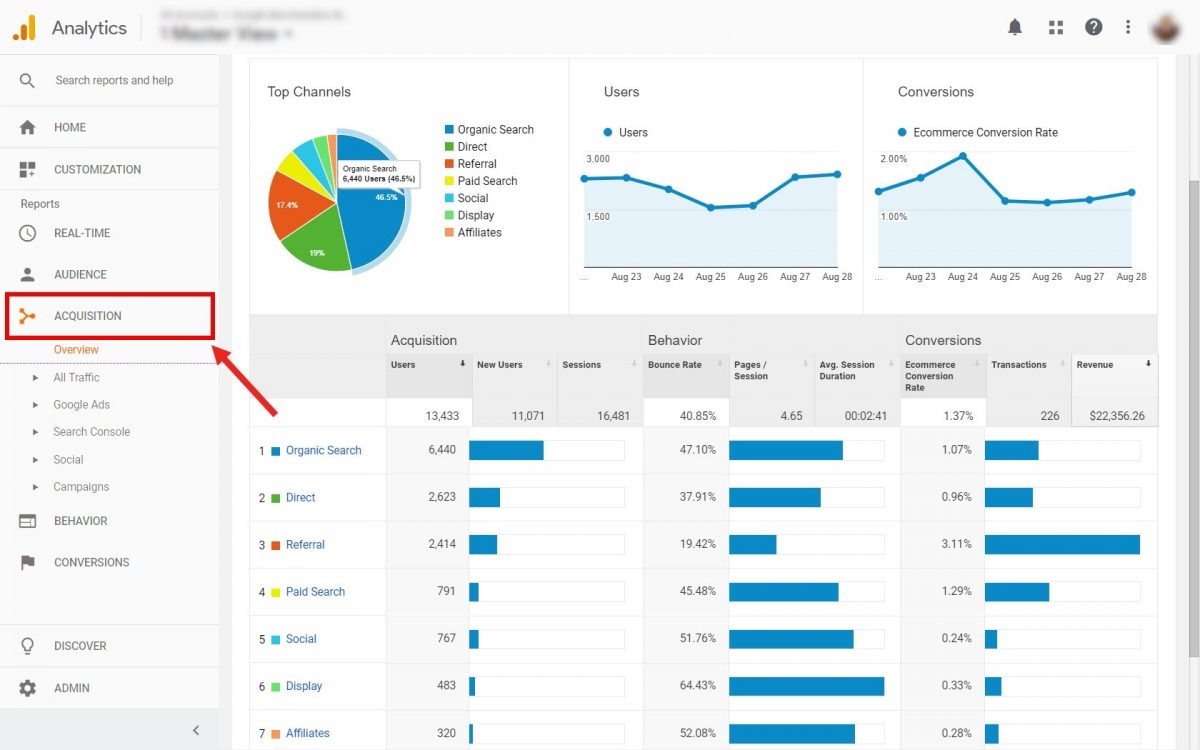
Same as the other two sections that we covered, acquisition reports are divided into a few sub-reports as well.
- Overview – Here you can have a glimpse at ABC data (Acquisition, Behavior, and Conversions) for the top traffic sources grouped into channels.

- All Traffic – These reports will tell you everything you need to know about what drove visitors to your website (All Traffic). You will see your traffic broken down by main categories (Channels) and specific sources (Source/Medium).
 Referrals are websites that contain links that lead to your site (backlinks). Finally, Treemaps are a visualization of how much each medium contributed to your traffic.
- Google Ads – If you’re using Google Ads, you can track their performance and learn what people do once they click on them to get to your site.
- Search Console – This report helps you understand which search queries brought traffic to your site, as well as which pages users land on (landing pages). More on this in a later section where we discuss metrics that you need to keep an eye on. For this to work, you need to adjust Search Console Settings in your property settings.

- Social Report – If you want to know which social media platforms send users to your site have a look at this report. You can also see the landing pages, which social networks contribute to conversions, as well as Users flow (similar to the one we mentioned in the audience reports), and much more.

- Campaigns – In this report you can have a look at ABC data about your organic and paid campaigns. You can also analyze the cost of each traffic source.
4. Behavior reports
Behavior reports help you measure the performance of your pages and your content.
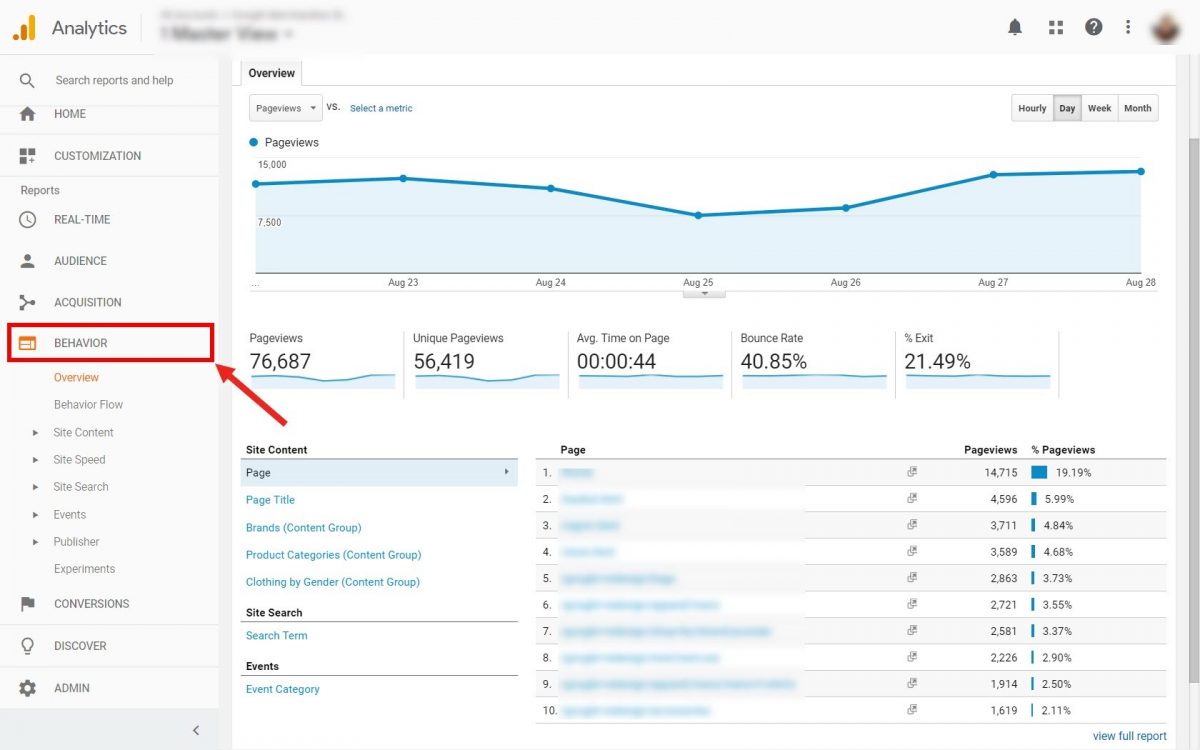
Sub-categories included in this report are:
- Overview – Have a quick look at key metrics like page views and bounce rates for each of your pages.
- Behavior Flow – It visualizes the path users travelled from one page or Event to the next. This report can help you discover what content keeps users engaged and also help identify potential content issues.

- Site Content – If you want to know more about the engagement of your content, this is the right place. You can measure some key metrics such as page views, avg. time spent on page, bounce rates, exit %, as well as page value (for e-commerce).

- Site Speed – The Site Speed reports show how quickly users are able to see and interact with content. You can identify areas that need improvement and even see suggestions on how to make those improvements.

- Site Search – Site Search lets you understand how much visitors use your site’s search function, which search-terms they enter, and how effectively the search results create deeper engagement with your site.
- Events – Events are user interactions with content that can be tracked independently. Events let you track special content like videos, downloadable items, and embedded gadgets. To use this feature, you need to set up Event tracking. More on this in a later section of this article.
- Publisher – These are reports to help you analyze your Ad Exchange performance in conjunction with other Analytics data about your site.
Conversion tracking
Conversion tracking reports are the final section of Google Analytics standard reports.
In Analytics, a conversion is the completion of an activity that is vital for your business to be successful.
This can be a powerful way to use data to understand whether you’re meeting your business goals.
Each time a user completes one of your business goals, this is called a “conversion.” This could be signing up for a newsletter or buying a product from your e-store.
Let’s take a look at the two most common examples of goals and how to set them up.
You might want to track the email signups on your page or track purchases from your e-commerce website.
In the first case, your goal would be a visit to a “Thank you” page that users visit once they sign up for your newsletter or lead magnet.
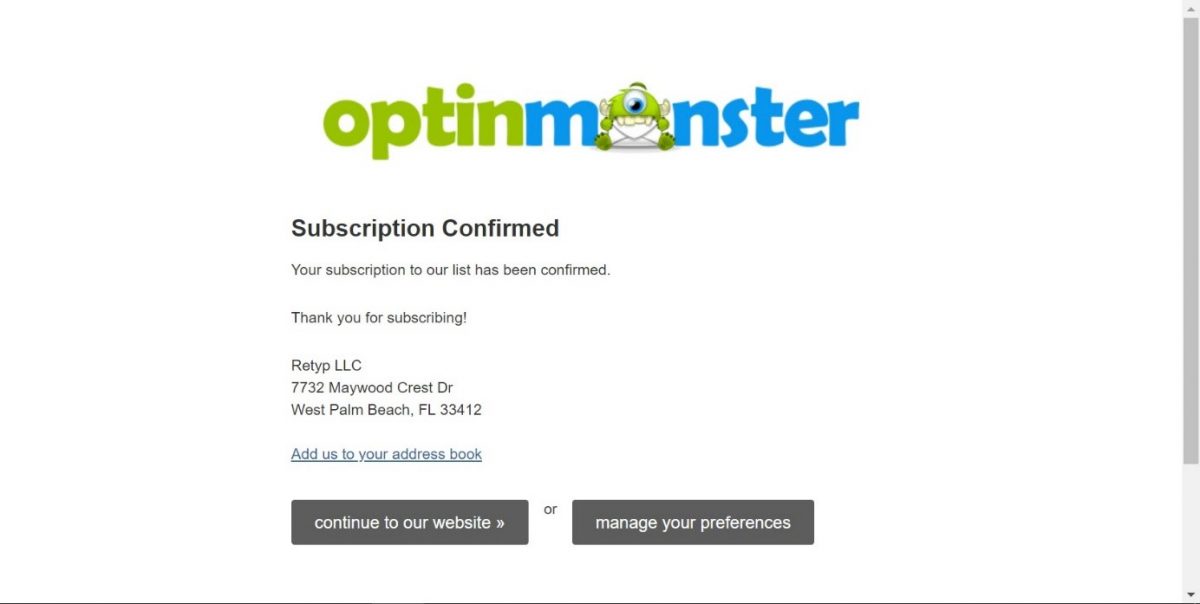
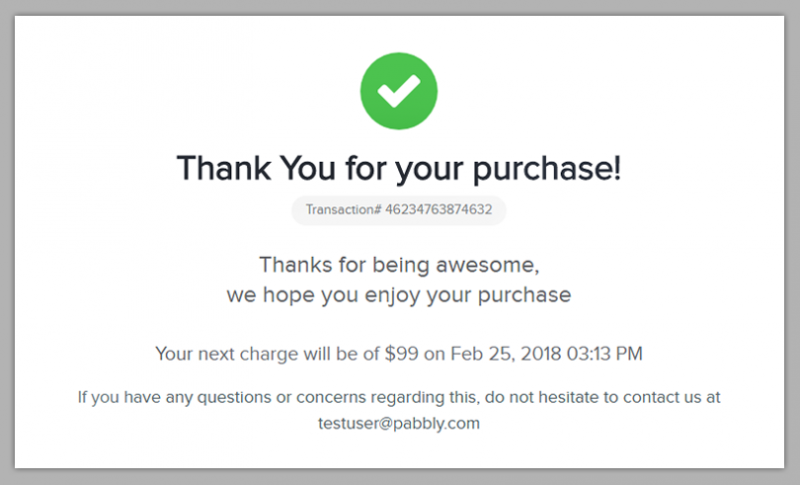
For the second example, the goal would be a visit to the “Check out confirmation” page that users are taken to once they make a purchase and complete a transaction.
To set your goal, go into the Admin section. Then, navigate to Views > Goals, and click the red button that says New Goal.
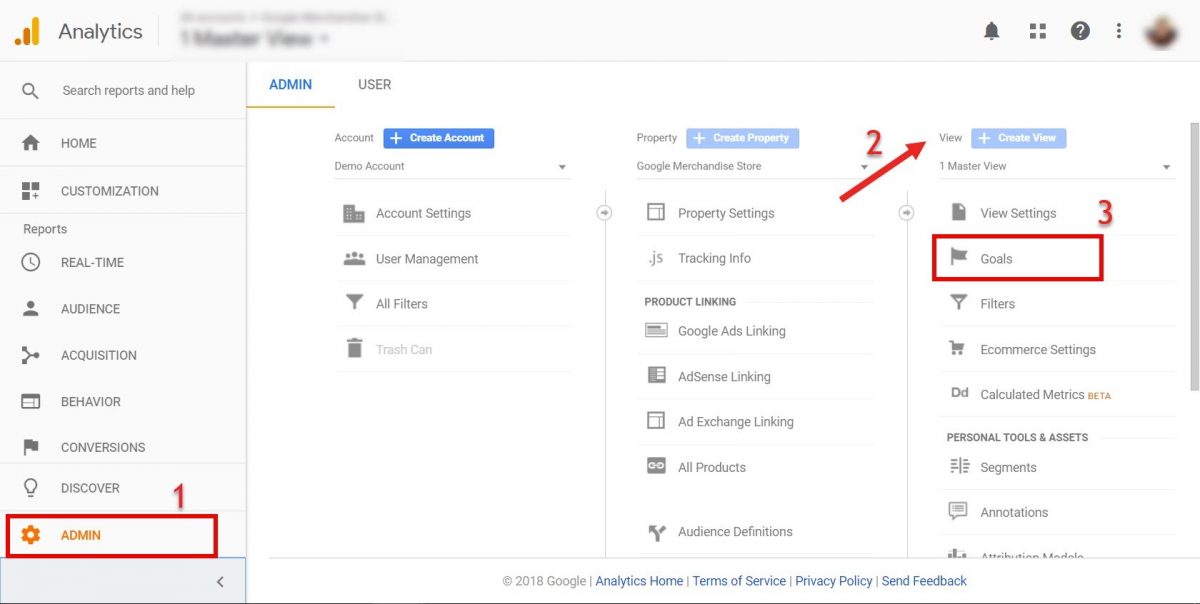
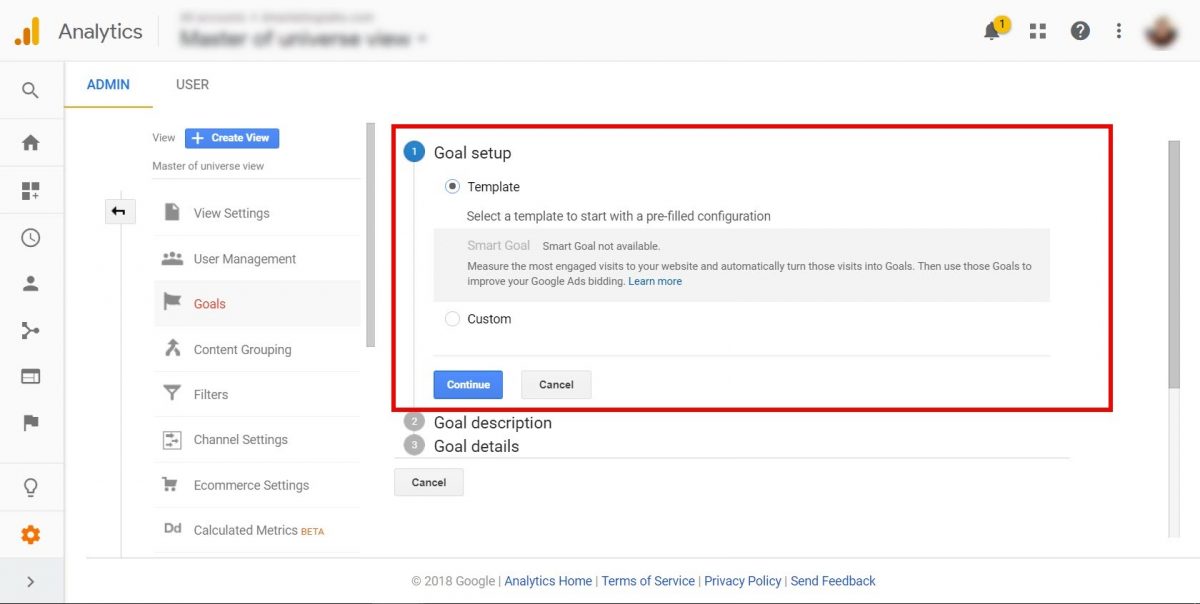
Analytics provides you with some pre-set business goal templates.
You can choose a pre-made template or you can make a custom goal of your own. Once you’re done, click on Continue.
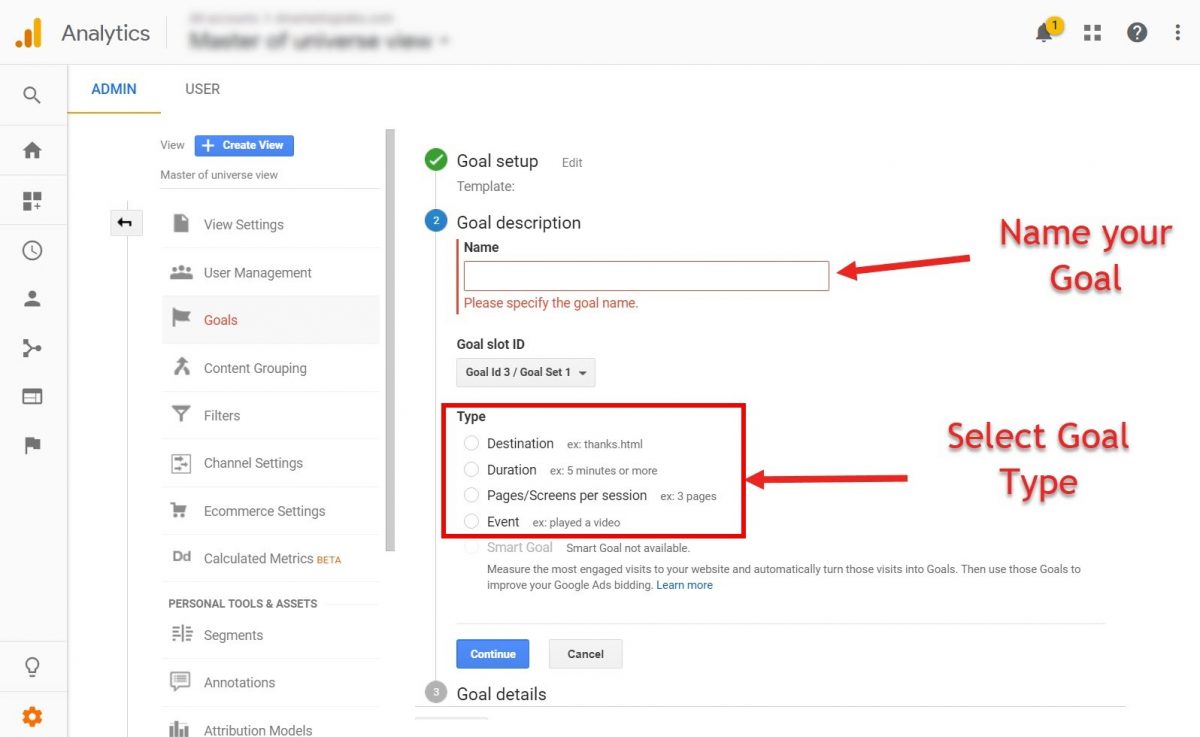
Next, give your goal a descriptive name that you will remember, such as “registration” or “purchase completed”.
Choose one of the four goal types that are available:
Each of these goal types is triggered by a particular user action.
- “Destination” is when a user reaches a specific page on your site such as a thank-you page
- “Duration” is based on the length of a user’s session
- “Pages or Screens” is based on how many pages a user views in a session
- “Events” is for tracking specific actions on a site
Since in both of our examples the goal is to reach a certain page on your site, you can choose “destination” as your goal type.
Once you’re ready, click on Continue and it will open up this final section which is “Goal details”.
Here, you need to enter the destination URL of the “Thank you” or “Check-out Confirmation” page. The destination URL is shown when the user converts or completes the conversion process.
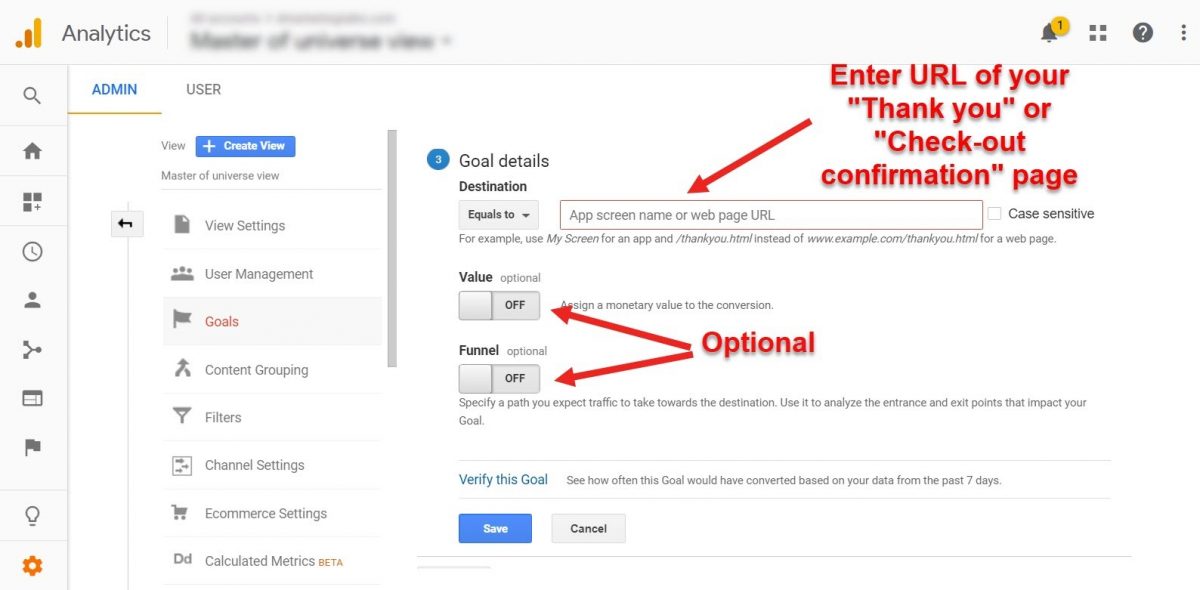
Note that you don’t need to input your entire page URL containing your domain name, you only need to set the exact page location. For example: “ /thank you”.
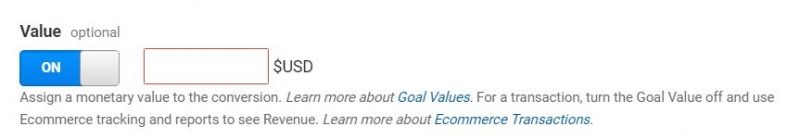
If you want to assign a monetary amount to the conversion goal, you can flip the “Value” toggle to “On” and type in the amount that each conversion is worth to you. You would only use this if each conversion is worth a consistent amount to your business.
For example, if each purchase was worth $1 for your business, you could set a goal value equal to “1.”
And finally, if you want to see a visualized funnel in your reports, you can flip the Funnel switch to “On” to add the funnel steps.
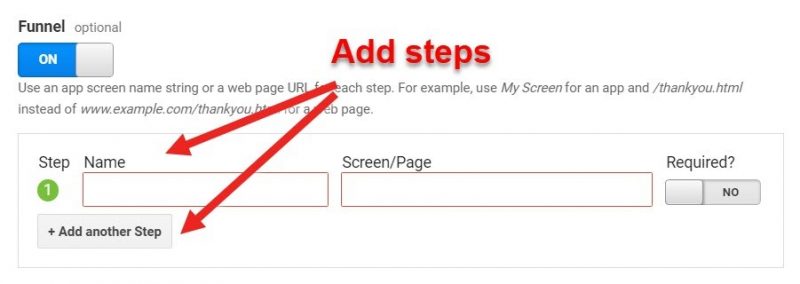
Each funnel step represents an action on your website that needs to be taken in order to complete the Goal. In our e-store example, you need to include a unique part of the URL for each page the user has to view in order to check out and make a purchase.
If a step is required to complete the goal, move the “Required” toggle to “Yes.”
Finally, verify that your goal can be tracked by Google Analytics. Then click on Save.
Once you click Save, you’ll see the Goal appear in the Goals list.
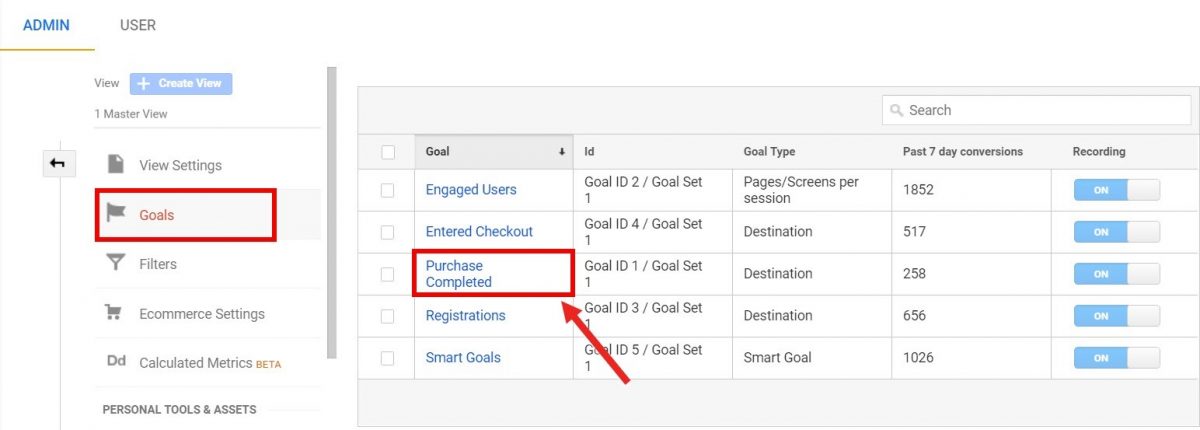
And that’s how you set goals in Google Analytics.
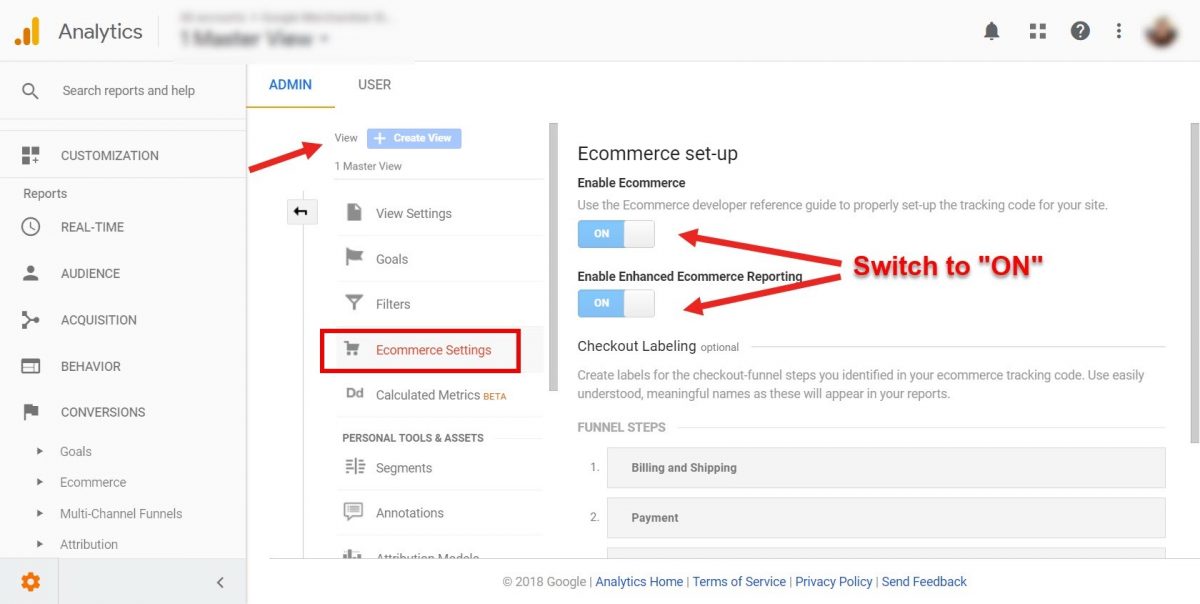
The other type of conversion tracking in Google Analytics is E-commerce tracking.
To enable E-commerce tracking, you can again go to Admin, and then navigate to View > E-commerce Settings. Flip the two toggles to “On”.
But you’re not done yet. You also need to add e-commerce tracking codes to pages on your site. For a full guide on how to do this, you can refer to this link.
If this proves to be too difficult for you, you can always contact a WordPress Agency like StableWP, and we’ll set everything up for you.
Once you’ve set up your goals, let’s take a look at the available reports for your conversion tracking.
This first section shows goal tracking reports.
You have an overview of all of the key metrics for goal tracking as your first report.
This first section displays the number of goal completions, their value, the goal completion rate, as well as the abandonment rate or the percentage of people that have abandoned your funnel and not completed the goal.
Below you can see the number of completions for each of your set goals.
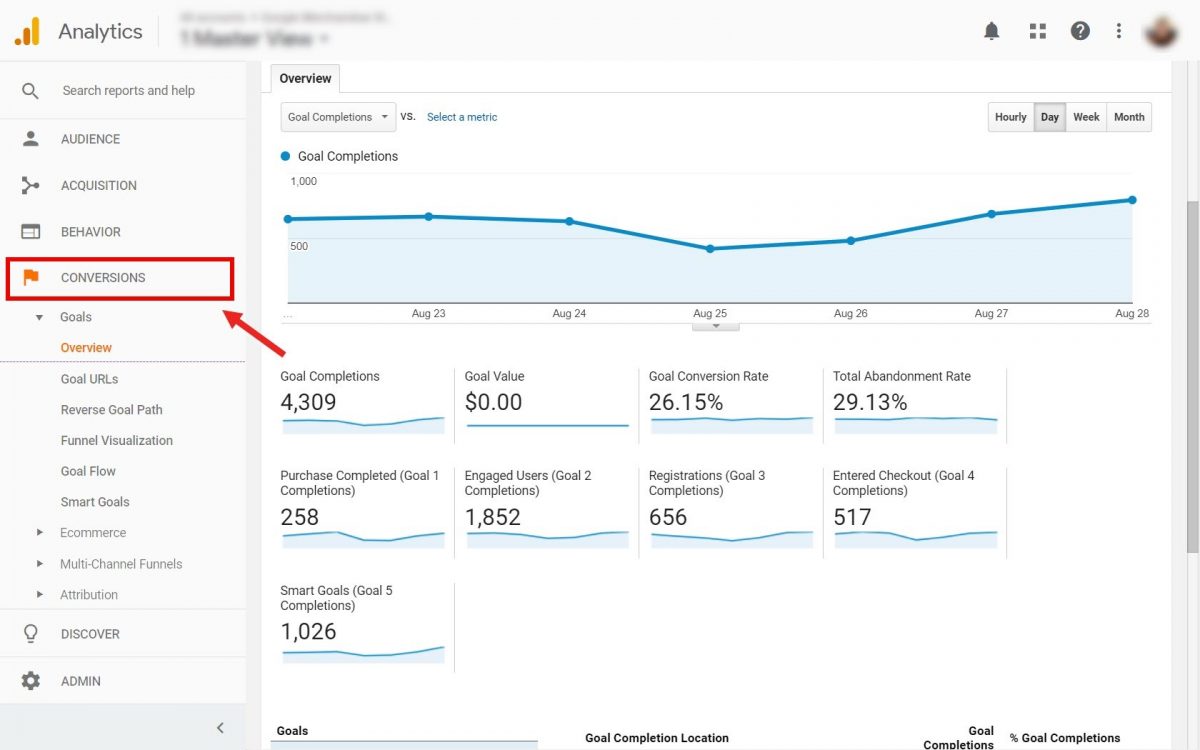
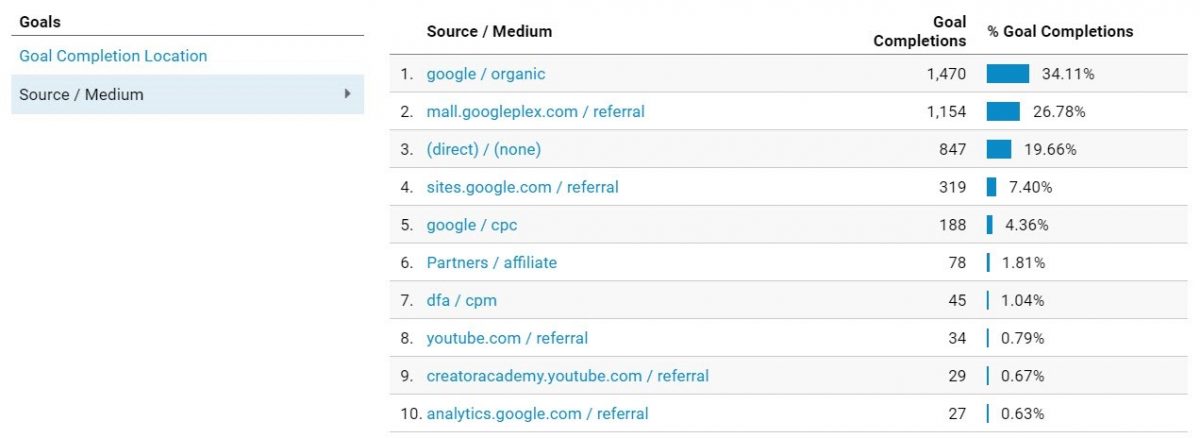
And finally, you can see the breakdown of your goal completions by source or medium.
Other reports in this section, include:
- Goal URLs – Identify URLs where your goals were completed.
- Reverse Goal path – Shows the reverse funnel for your completed goals.
- Funnel visualization – If you have set up your Funnel visualization, this is where you can see that report. Each section of the funnel shows the percentage of people who continued to the next step, as well as a final funnel conversion rate at the bottom. The funnel conversion rate measures the percentage of people who entered the funnel and completed the final Goal. This can help you identify potential steps in your marketing Funnel that have low completion rates and try to figure out why that is the case and how you can improve them so more people will complete these steps.

- Goal Flow – The Goal Flow report shows the path your traffic traveled through a funnel towards a Goal conversion. This report can help you see if users are navigating your content as expected, or if there are problems, such as high drop-off rates or unexpected loops.

- Smart Goals – See the performance of your Smart Goals. This is a way to measure the performance of your Google ads and how they contribute to conversions on your site.
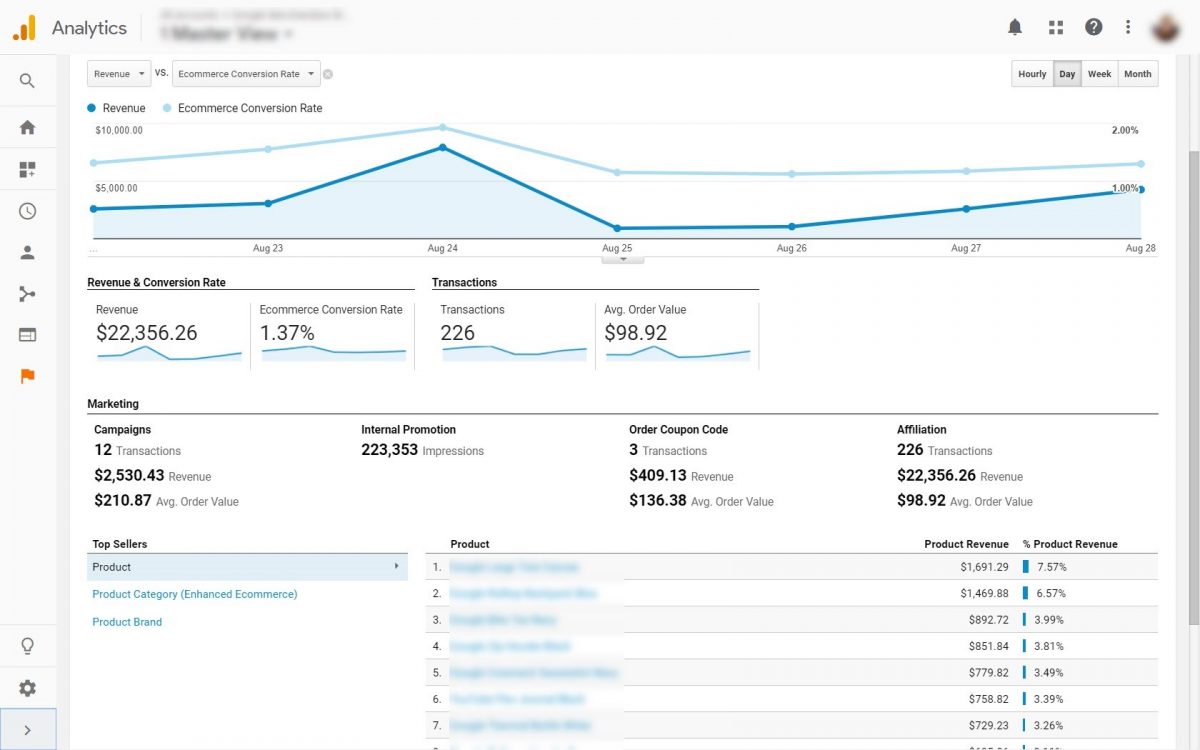
Next, you have E-commerce reports.
These reports allow you to analyze purchase activity on your site or app. You can see product and transaction information, average order value, e-commerce conversion rate, time to purchase, and other data. For this to work, you need to Set up E-commerce Tracking (as mentioned before).
Here you can see reports such as:
- Shopping behavior – Lets you see the number of sessions that included each stage of your purchase funnel, how many sessions continued from one step to the next, and how many abandoned the funnel at each stage. The red arrow indicates abandonment and it means users didn’t proceed to the next step.

- Checkout behavior – Shows you how your users successfully moved through your checkout process. The checkout-funnel visualization illustrates how many users moved on from one step to the next, how many abandoned the process at each step, and how many entered the process at each step.

- Product performance – Revenue, Purchases, Quantity, Average Price, and Average QTY by SKU and Category.

- Sales performance – Performance of each transaction in terms of Revenue, Tax, Shipping, Refund amount, and QTY.
- Product list performance – Compare product lists to each other.
The final two reports are:
- Multi-Channel Funnels – Allows you to understand what role did prior website referrals, searches, and ads play in each conversion.

- Attribution – This report features the Model Comparison tool, which allows you to measure exactly how much each channel contributed to the conversion.

Read our complete conversion optimization guide and learn proven tactics that can boost your conversion rate.
Now that we’ve covered all the reports that you have at your disposal in Google Analytics, let me show you some key metrics that you need to watch as a small business.
Key metrics that you need to track
During the course of this article, you have to be aware of all the reports offered by Google Analytics.
And you can see it’s quite an extensive list of reports and tools.
But what do these reports and metrics mean for your business?! What decisions do you need to make based on this data, and how?!
As I mentioned at the beginning of the article, the key benefit doesn’t lie in the data itself, but in how you use that data to improve and grow your business online.
To help you with this, I’ve compiled a list of the 10 most important reports and metrics, you need to keep an eye on!
1. Traffic Sources
All the traffic that you receive has to come from somewhere. In Google Analytics, traffic sources indicate just that, where your visitors clicked on a link to your site.
There are two main things you want to know about your Traffic sources:
- Which sources bring in most visitors
- Which sources get the most conversions (sign-ups or purchases)
In the first case, you can go to Acquisition reports, then All Traffic > Source/Medium and take a look at which channels brought the highest amount of traffic to your site.
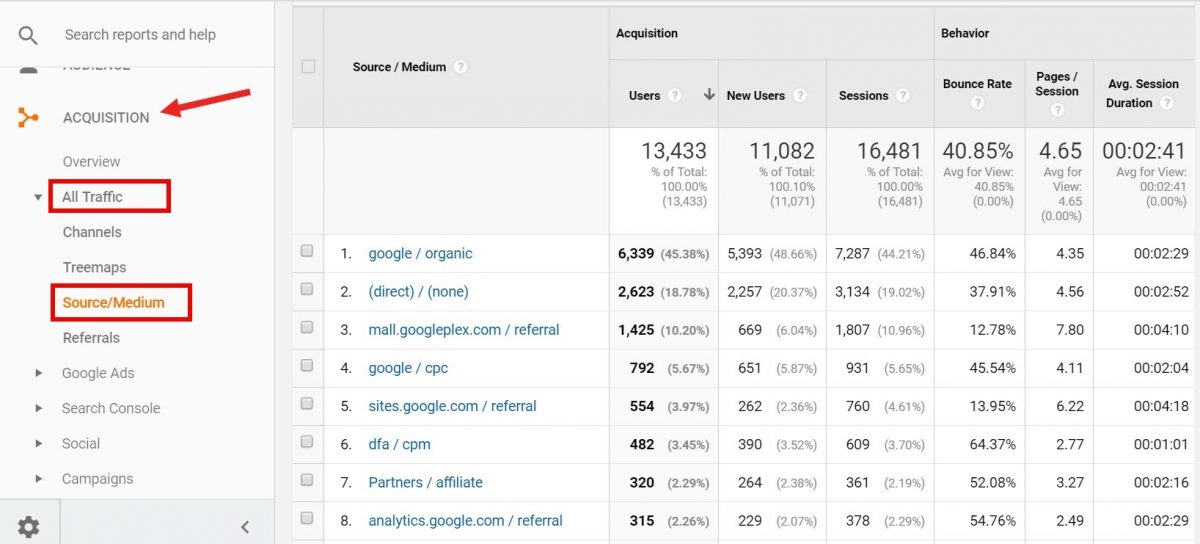
In this example, the largest number of users and new users came from organic searches on Google. Search brings the most visitors, meaning you need to double-down your investments in SEO to get even more traffic.
Other channels like Facebook, YouTube, Reddit are not even among the top 10 sources.
To get a complete picture of the most valuable traffic sources, let’s have a look at which ones have the highest conversion rates.
Click on the Conversion rates column to sort the results by this metric.
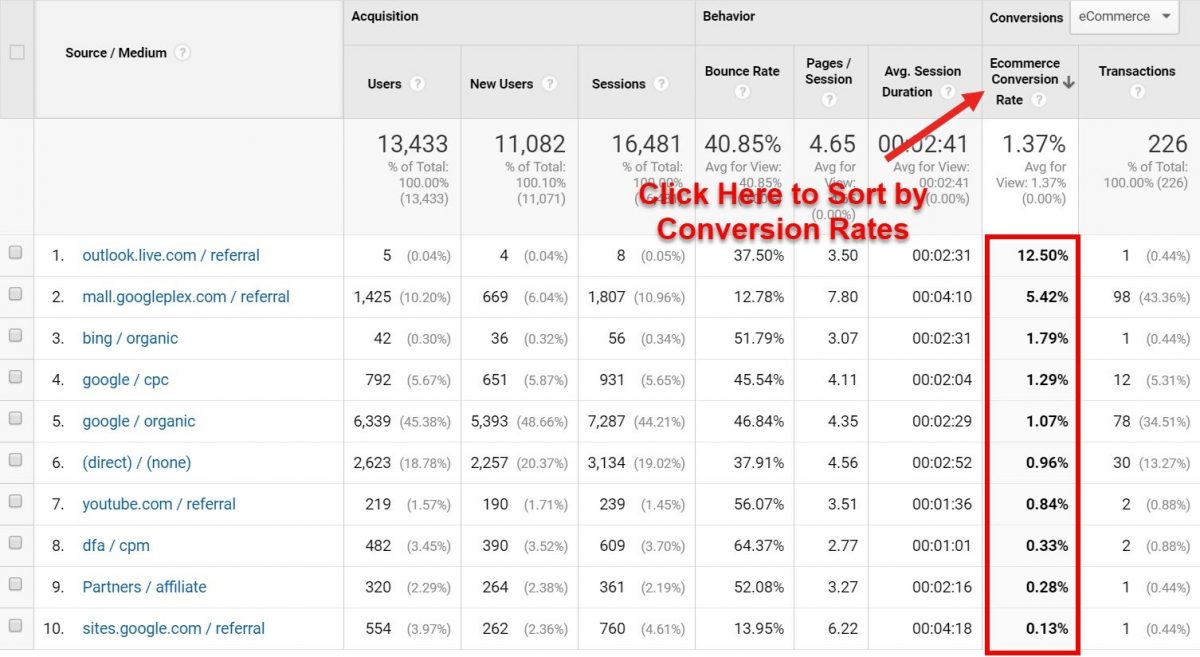
Now we see a slightly different picture; even though organic searches bring the largest amount of traffic, in terms of conversions, they come in fifth.
The top spot is claimed by outlook.live.com, but this source only brought 5 users.
Actually, the highest-quality traffic comes from mall.googleplex.com! This channel brought in 1,425 visitors with a conversion rate of 5.42%, meaning more than 77 of them have bought items from this e-commerce store.
By analyzing traffic sources, you can determine which digital marketing channels are the most valuable to you. Depending on your goals and set KPIs, you can go “all-in” and invest in sources that get you the most visitors or the highest conversion rates.
2. Bounce Rates
Bounce rate is a metric that measures the percentage of people who land on a page on your website, and don’t do anything. They don’t click on any links, they don’t spend any time there. They simply leave your site after visiting that page.
Your bounce rates are a good indicator of the quality of your content or the quality of your audience.
High bounce rates usually mean one of two things:
- Either you’re targeting the right audience with the wrong content (low-quality content), or
- You have good content, but you’re targeting the wrong audience (low-quality audience)
In both cases, there are actions you can take to deal with these issues and turn things around.
For example, if visitors land on your blog post, quickly glance over it, then leave without any interactions. You need to make them spend more time on that page.
Perhaps the introduction part of your article is too long and not engaging, making them exit immediately.
In this case, you can write shorter introductions that are straight to the point. Also consider leaving a clickable table of contents—like in our post here—that allows users to jump to any section that they might be interested in, instead of reading the entire article.
If you have high bounce rates on a page that contains your sign-up form, then this can potentially be a big issue. You need to improve this page to get more people to sign up. You can do this by optimizing your form with a clear call-to-action.
These are just some examples of what you can do.
In general, when facing high bounce rates ask yourself:
- How’s the usability of the page?
- Is there a call-to-action above the fold on the page?
- Do you have internal links that point to related pages or posts?
- Do you have a menu that’s easy to use?
- Does the page invite people to look further on your site?
More often than not, answering these questions will help you identify the culprit.
3. Landing Pages
A landing page is the first page viewed in a session. So, in your Google Analytics reports, a landing page is the entry point to your website.
Examining the landing page report, you can learn a lot about how visitors arrive on your website. You can use this report to see how your pages generate traffic.
There are two areas in GA that feature Landing Page reports:
- If you go to Acquisitions reports, then navigate to Search Console > Landing Pages, you can see which pages received the most traffic from an organic search. This is especially useful since you can’t see which keywords people search for before they got to your site. But at least you can understand what pages and content bring search traffic to your site, so you can identify what your potential customers are searching for and which keywords are effective at generating traffic.

- The other report in which you can find Landing Pages is the Behavior report. Go to Site content > Landing pages to check out how engaging each of your landing pages is. You can understand which pages brought most users and sessions, which pages have high bounce rates, and even conversion rates of each of your landing pages. These reports help you understand which pages and content are engaging, which ones need improvement, and which ones drive people to buy or sign up for your newsletter.

4. Exit Pages
Exit pages are the opposite of landing pages. They are pages from which your visitors left your website.
They are not inherently bad, as people will eventually leave your site, and they have to exit from somewhere.
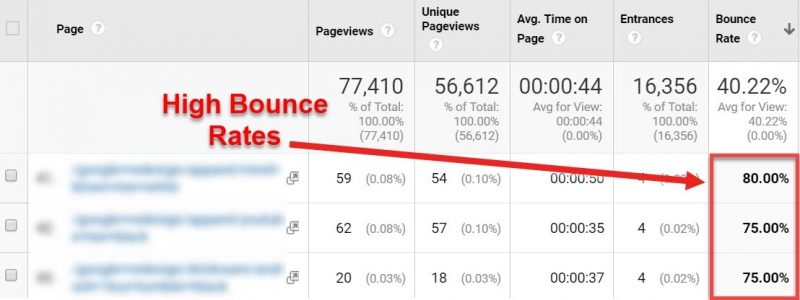
However, if you identify pages that have unusually high exit rates, you need to inspect them closer and see why people are exiting so often from there.
To see the Exit Pages report, go to Behavior and then Site Content > Exit Pages.
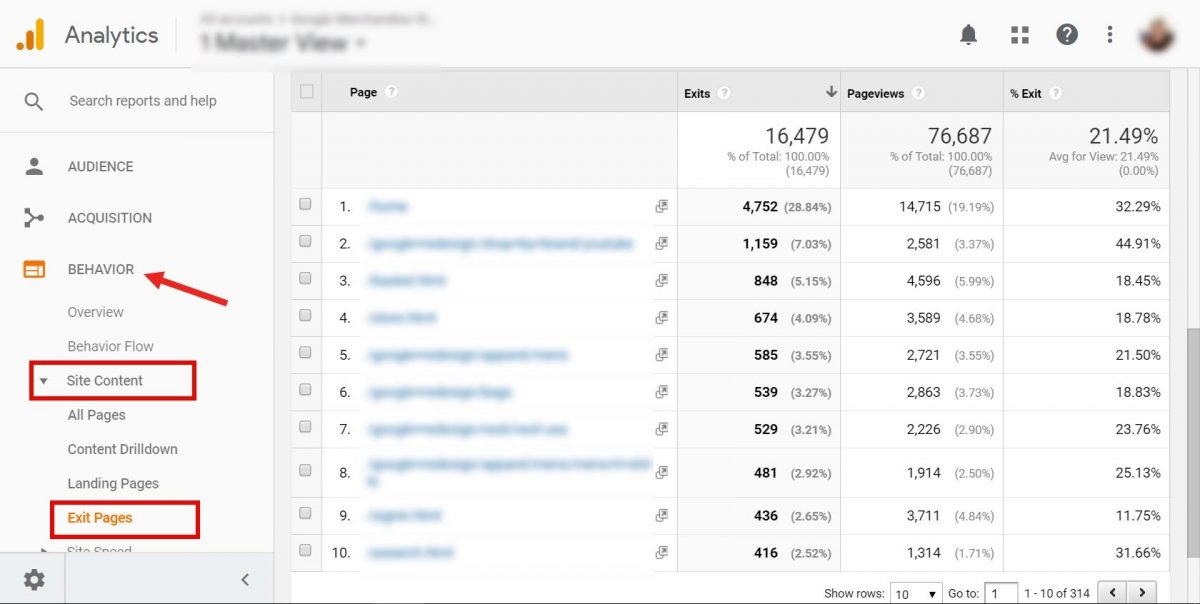
Click on the %Exit column to sort by Exit rates. Then check if there are any pages that are much higher than average exit rates.
Have a look at these pages and try to determine why people are abandoning your site from these specific pages.
5. Site Speed
Your site’s loading speed is a critical performance indicator of your site. This is a huge deal for two main reasons:
- Loading speed is one of the biggest ranking factors for Google
- The faster your site loads, the better the user experience your visitors have
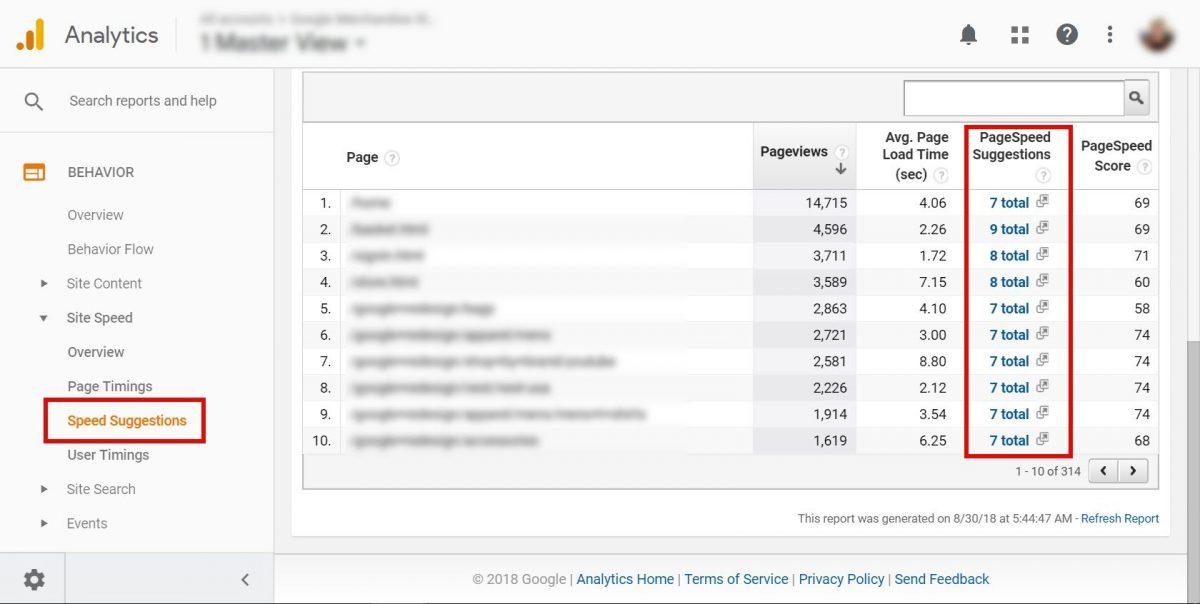
To check your speed in Google Analytics, go to Behavior then Site Speed > Page Timings.
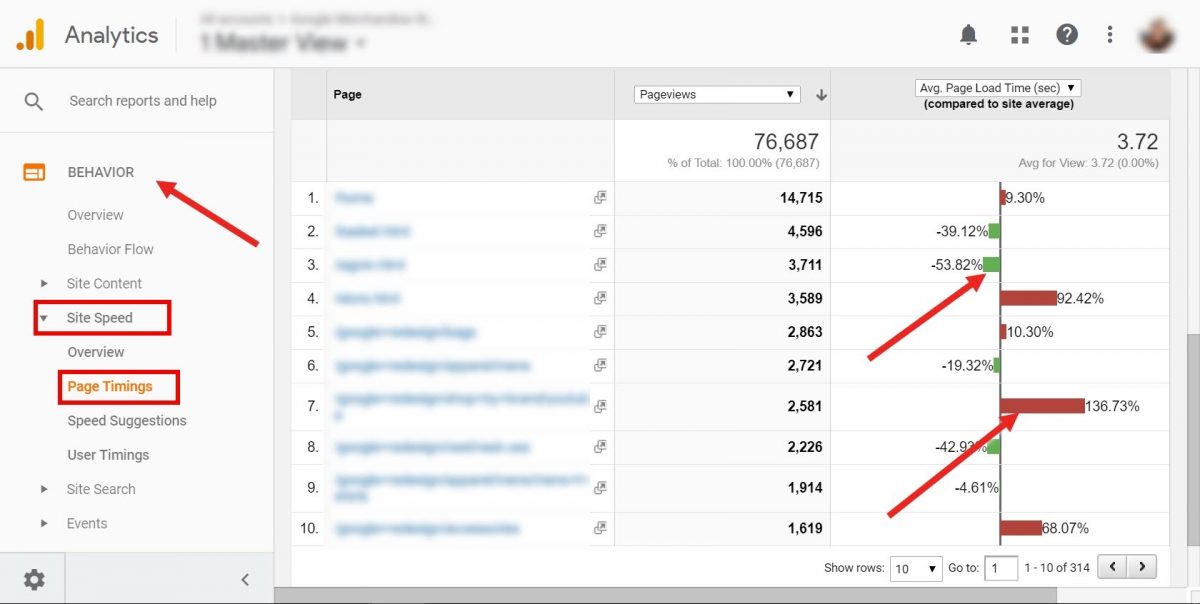
Here you can see how each page on your site performs in terms of loading speed. Pages marked by green are faster, and the ones marked by red are slower than the average on your site.
Have a look at these pages and try to uncover what is making them so slow. Do they have high-res images that need to be compressed? Maybe there are videos that slow these pages down? Or maybe you need some On-page optimization for these pages?
Below this report, you can access Speed Suggestions, where you can find exactly what’s slowing those pages down and what you need to do about it.
Learn how to boost your site speed and make your website load in less than a second in our WordPress Speed Optimization guide.
6. Devices
This is another important report that you need to look at. You can find it under the Audience>Technology>Mobile section.
You get to see which operating systems, networks, and devices people are using to access your website.
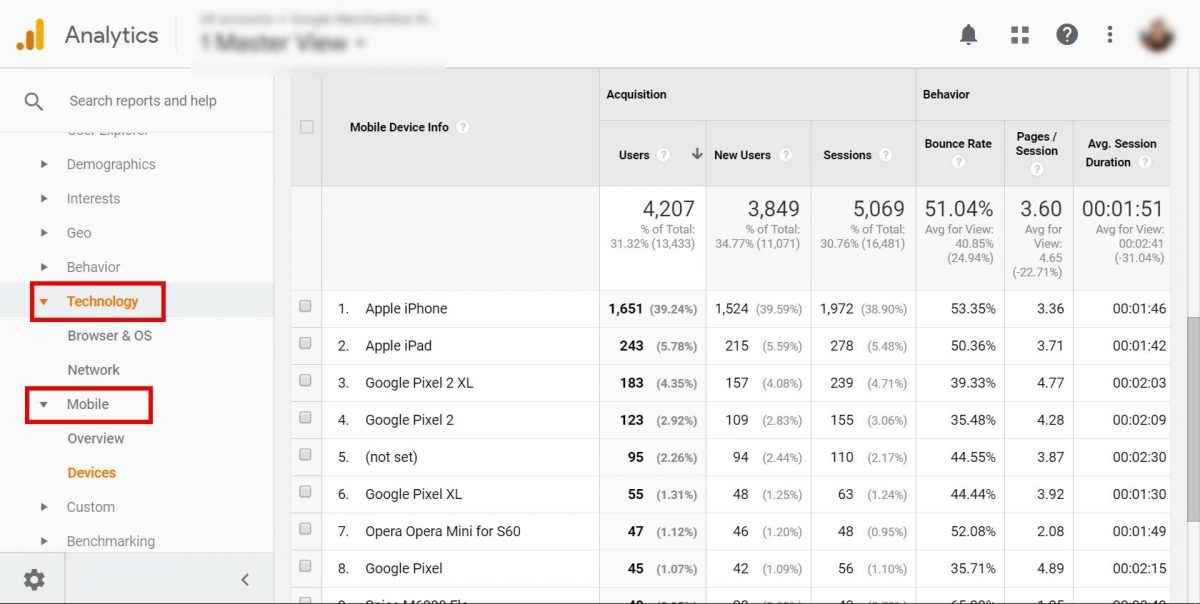
If you see a large number of visitors using a specific OS or device, then you need to optimize your site for them, because they’re a significant part of your overall traffic.
And you want to provide the best performance and user experience for your main visitors!
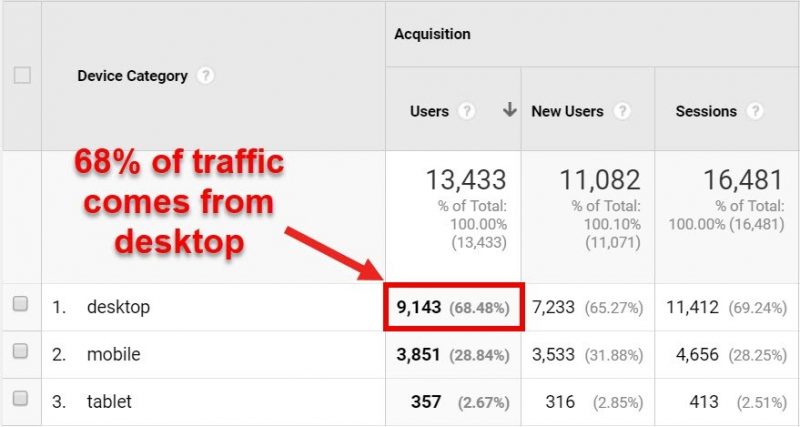
Also, many people jump to the conclusion that they need to focus mostly on mobile devices since they heard that the mobile usage rate is growing exponentially.
So, they might make the mistake of not considering their desktop user experience, even though, most of their users are actually coming from PCs.
7. Visual Funnel
We already talked about Visual Funnels in the Conversion Tracking section.
Google Analytics offers a pretty comprehensive Visual Funnel that can show you how your visitors are moving from the landing page to the end of the check-out process.
This can help you understand which steps they need to take from start to finish. So, you can make an informed decision to eliminate unnecessary steps.
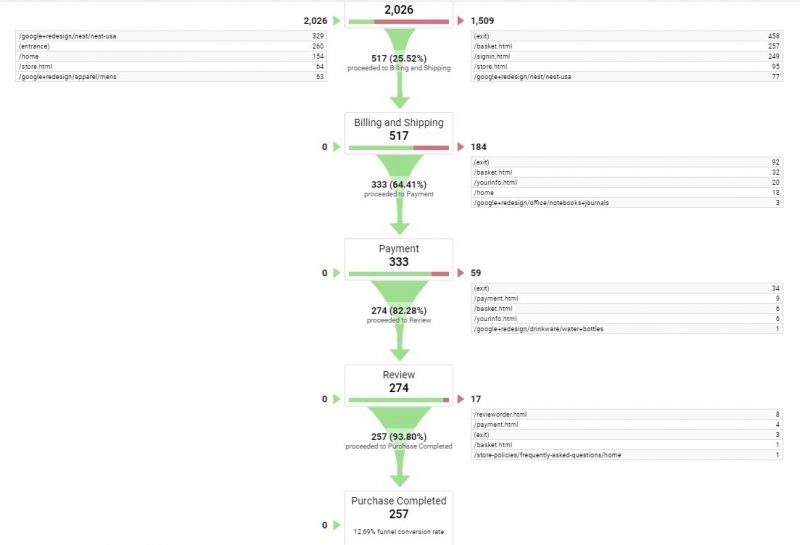
Also, examine steps that have high drop-off rates and see what is making them exit the process and not go through to the end. Then improve or eliminate these steps to get more people to complete the check-out.
Learn more about how to design a perfect check-out flow with these 23 tactics that boost sales.
8. New vs Returning Visitors
Under the Audience report, you can find a section focused on behaviour, which contains New vs. Returning Visitors report.
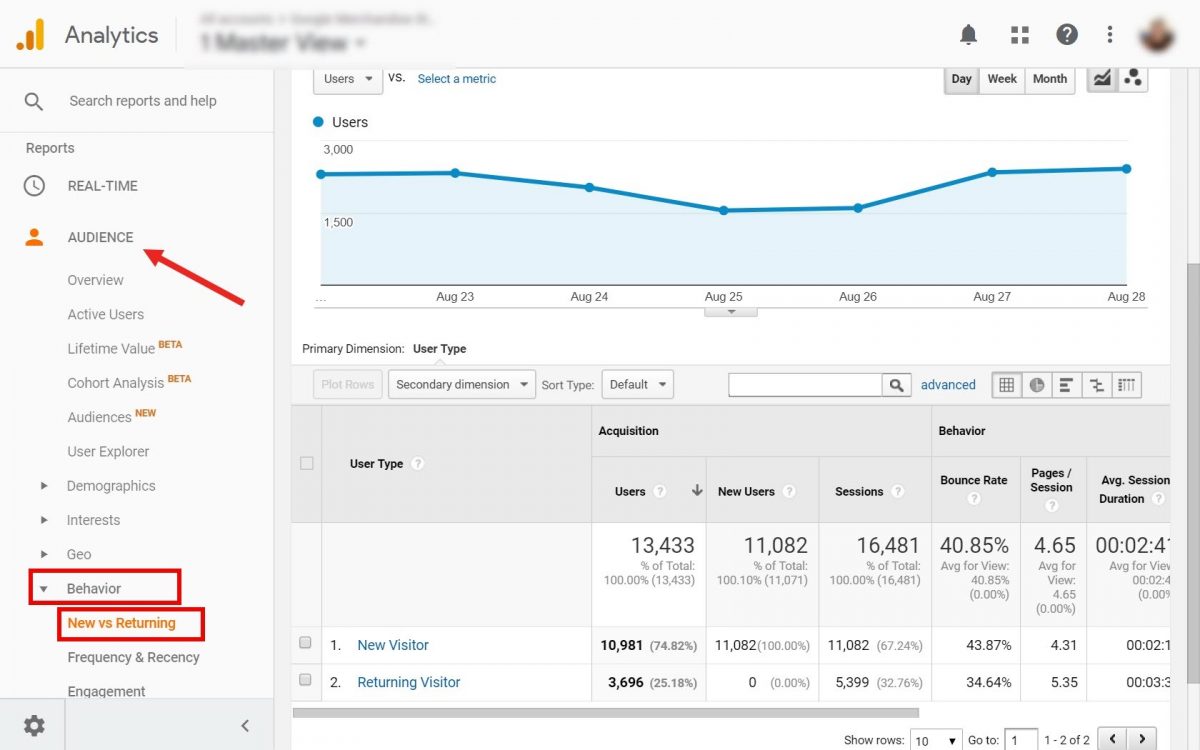
Here you can see which % of users are new, compared to the ones that are returning to your site multiple times.
Acquiring new users is very difficult, time-consuming, and expensive. That’s why you want to keep your existing ones and get them to return to your site again and again.
This report will help you understand how many of them are returning and if you need to make more efforts to keep your existing visitors coming back.
9. User Explorer report
As mentioned in the previous section, User Explorer is a way to inspect and track individual users rather than groups or all users.
This can be very important to understand user behaviour and their purchasing cycle.
Namely, this is because most of the time, users don’t purchase anything on their first visit. It might take them 3–4 visits to actually decide and buy something from your e-commerce shop.
So, if you just have a look at the aggregate traffic sources and their conversion rates, you might think that some channels are not effective at driving sales.
What really happens is that a single user might come from different sources each time. Thus, skewing the data and making it a bit more difficult to understand what’s going on.
For example, someone might get to your site initially after clicking an ad. During their first visit, they might not buy anything.
Later, they might come back from a different source, like directly from a bookmark or from a Google search. And this time they might actually buy something.
This exact scenario might happen for many users, potentially leading you to the conclusion that ads are ineffective at getting people to buy your products/services.
But, that’s not true. In such a case, your ads played a crucial part in the purchasing process. They were the ones that raised the awareness of your brand and products and sparked the interest. It’s just that people need a bit more time to make a purchasing decision. That’s why they need to come back to your site multiple times.
And that’s why you need to inspect their behaviour with User Explorer.
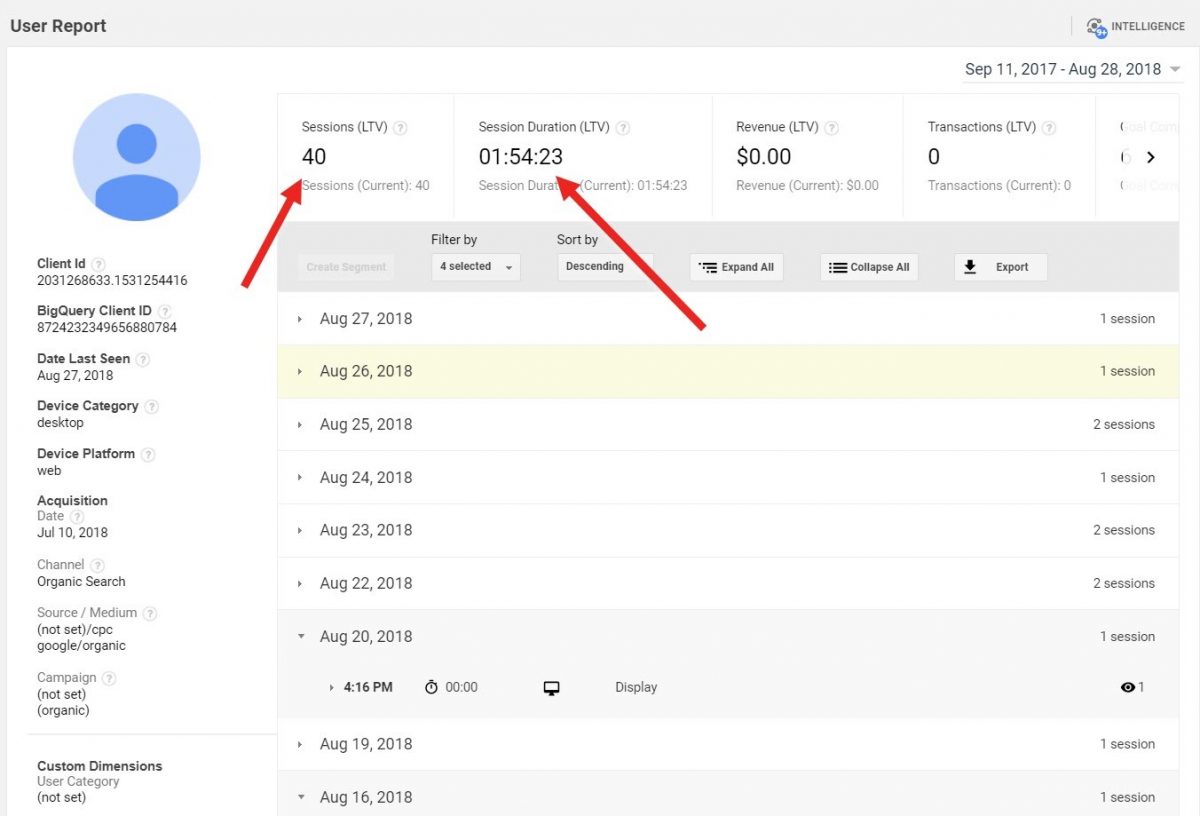
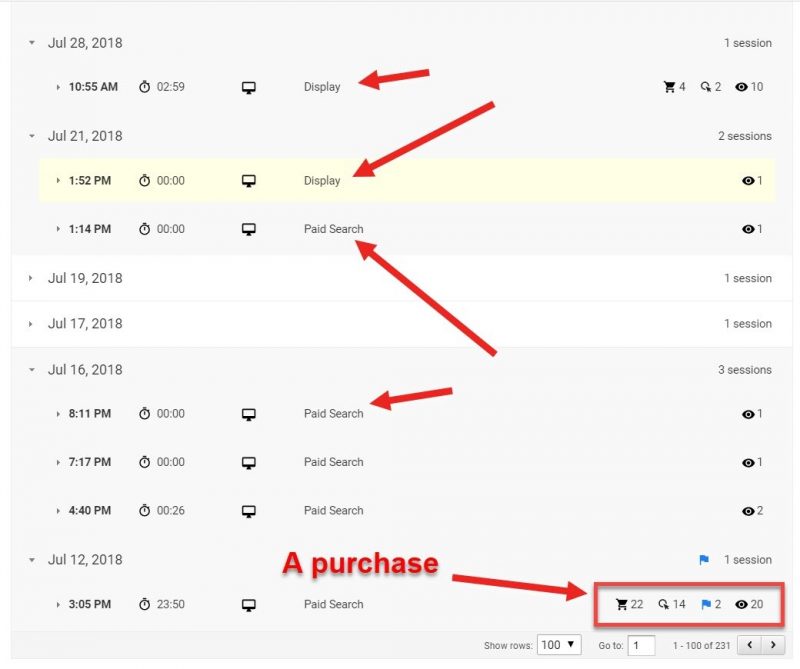
It took 40 visits, almost two hours on the site, and many different traffic sources until this person actually decided to buy something.
10. Events tracking
Events tracking allows you to record and measure interactions with specific elements on your site that are not tracked with standard Google Analytics reports.
Some typical examples are:
- Tracking outbound links to other websites
- Tracking clicks on email addresses or click-to-call phone numbers. This can help you to better understand the number of inquiries you are getting from your site
- Tracking downloads from your website (eBooks, PDFs, spreadsheets, etc.)
- Measuring interactions with video content, such as the number of views and time spent watching
- Monitoring clicks on unique elements of a page, such as calls-to-action
- To set up events to record conversions relating to phone number clicks and calls, etc.
Events tracking can help you in so many ways.
For example, you might embed a video onto your site, because you heard video content is exploding in popularity in recent years.
But does it actually contribute to your marketing strategy?!
To find out, set an Event to track your video’s performance.
After a while, check to see how your video is performing. Go to Behavior reports, then click on Events.
As you can see, not many people are actually clicking to watch your video. The click number is low, and the watch time is even lower.
This means, embedding a video on your site is not benefiting you at all!
And it’s actually hurting you. It’s slowing down the loading speed of this page.
In such a case, the best decision would be to remove the video from your site altogether.
Conclusion
Analyzing your performance is a key part of your digital marketing strategy. You need to optimize and improve your strategy based on your past results.
Google Analytics is an extremely powerful tool, which can provide you with detailed insights into how both your site and your digital marketing is performing. So, you can make data-driven decisions about what already works (so you can do more of that), what needs to be improved, and what hurts your small business (and needs to be eliminated).
Now, over to you!
Use this guide to properly set up GA for your website and understand the reports you have at your disposal, so you can take full advantage of this amazing, free tool.
And let us know, down in the comments section, which KPIs you are tracking with Google Analytics.
[do_widget id=custom_html-25][/fusion_text][/fusion_builder_column][/fusion_builder_row][/fusion_builder_container]